
Sometimes when we make automated analysis with Splunk, it might be necessary to use information that was entered or edited manually. For example, the classification of network hosts: do they belong to the PCI-DSS Scope or another group critical hosts or not.
In this case, Confluence can be quite a convenient tool for maintaining such a registry. Page with a table can be created very quickly and multiple employees can immediately start working with it.
Let’s see how to convert such table, export it to Splunk and use it with other data.
I will continue with the example from “How to correlate different events in Splunk and make dashboards” where we checked that some software was installed on all network hosts.
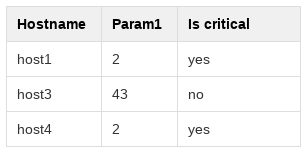
Now I created a new page with a table in Confluence. Some network hosts in this table I classified as critically important.
You can read how to get a page from Confluence using the API in my post “Confluence REST API for reading and updating wiki pages“.
You get a page from Confluence as in html format. How to turn html table into JSON, which can be sent to Splunk using the HTTP Event Collector? I do this with BeautifulSoup. I get lists for the rows and for the header, and then I make a list of dicts from them. Something like this:
from bs4 import BeautifulSoup
import re

value = HTML_CONTENT
value = re.sub(".*<table>", "<table>", value)
value = re.sub("</table>.*", "</table>", value)

result = list()

rows = list()
for line in [[cell.text for cell in row("td")] for row in BeautifulSoup(value, "lxml")("tr")]:
    if line != []:
        rows.append(line)

head = list()
for param in [[cell.text for cell in row("th")] for row in BeautifulSoup(value, "lxml")("tr")][0]:
    head.append(param)

for row in rows:
    a = 0
    line = dict()
    for name in head:
        line[name] = row[a]
        a+=1
    result.append(line)

print(result)
Output:
[{u'Is critical': u'yes', u'Hostname': u'host1', u'Param1': u'2'}, {u'Is critical': u'no', u'Hostname': u'host3', u'Param1': u'43'}, {u'Is critical': u'yes', u'Hostname': u'host4', u'Param1': u'2'}]
Now we can send this data to Splunk, read “Export anything to Splunk with HTTP Event Collector” for more:
package = ""
timestamp = int(time.time())

for line in result:
    event = dict()
    event['time'] = timestamp
    event['host'] = line['Hostname']
    line['type'] = "classification_table"
    event['event'] =  line
    package = package + "\n" + json.dumps(event)
package = re.sub("^\n","", package)

print(package)

headers = {
    'Authorization': 'Splunk 6fa52c75-f0d8-4b44-a213-3f2440fb831q',
}

response = requests.post('https://[my-splunk-host]:8088/services/collector', headers=headers, data=package, verify=False)
If we will run this code every day (by cron), we will always have fresh classification data in Splunk.
Finally, how to use the new objects in Splunk Searches. I specifically made the column name in Confluence table with a space. To use this field in Splunk, we need to rename it to something without spaces | rename "Is critical" as is_critical.
For the rest, we do the same as in “How to correlate different events in Splunk and make dashboards“. If I want to replace “yes” to “+” in is_critical field, I can do it with | eval is_critical=if(is_critical="yes","+",null()).
index="test" | eval date=strftime(_time, "%Y-%m-%d") | rename "Is critical" as is_critical | fields date host type is_critical
| eval active_host=if(type="active_host","+",null())
| eval software_installed=if(type="software_installed","+",null())
| eval is_critical=if(is_critical="yes","+",null())
| fields - type
| fields date host type active_host software_installed is_critical
| stats first(*) as * by date, host
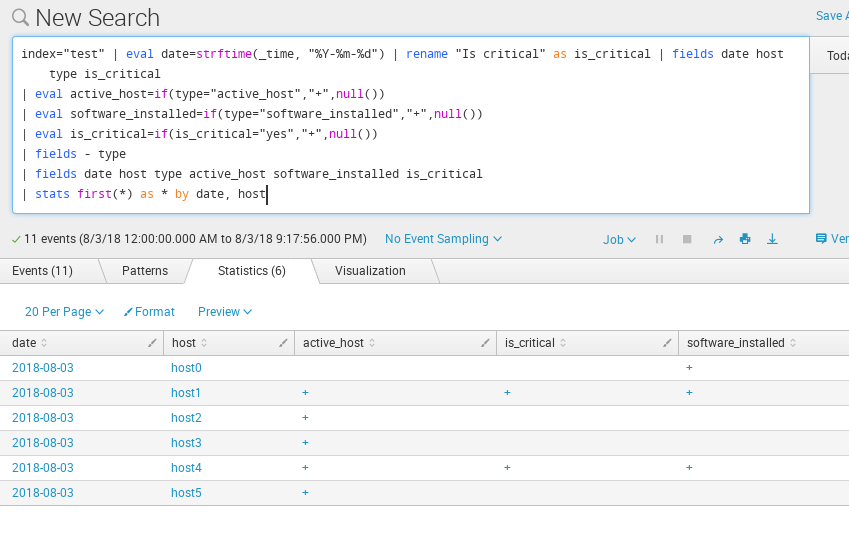
This table can be filtered. For example, we can add | where is_critical="+" to select only critical hosts.

Hi! My name is Alexander and I am a Vulnerability Management specialist. You can read more about me here. Currently, the best way to follow me is my Telegram channel @avleonovcom. I update it more often than this site. If you haven’t used Telegram yet, give it a try. It’s great. You can discuss my posts or ask questions at @avleonovchat.
А всех русскоязычных я приглашаю в ещё один телеграмм канал @avleonovrus, первым делом теперь пишу туда.
Pingback: How to list, create, update and delete Grafana dashboards via API | Alexander V. Leonov