
Recently I’ve spent some time dealing with Splunk. Despite the fact that I have already done various Splunk searches before, for example in “Tracking software versions using Nessus and Splunk“, the correlation of different events in Splunk seems to be a very different task. And there not so many publicly available examples of this on the Internet. So, I decided to write a small post about it myself.
Disclaimer: I’m not a pro in Splunk. I don’t have an idea if I am doing this the right or in optimal way. 😉 I just learned some tricks, they worked for me well and I want to share it with you.
I will show the following case:
- We have some active network hosts.
- Some software product should be installed these hosts.
- We will send “host X is active” and “software is installed on host X” events to the Splunk server.
- We want to get some diagrams in Splunk that will show us on which hosts the software is installed and how number of such hosts is changing in time.
As you can see, the task is quite a trivial and it can be easily implemented in pure Python. But the idea is to make it in Splunk. 😉
Sending data to Splunk
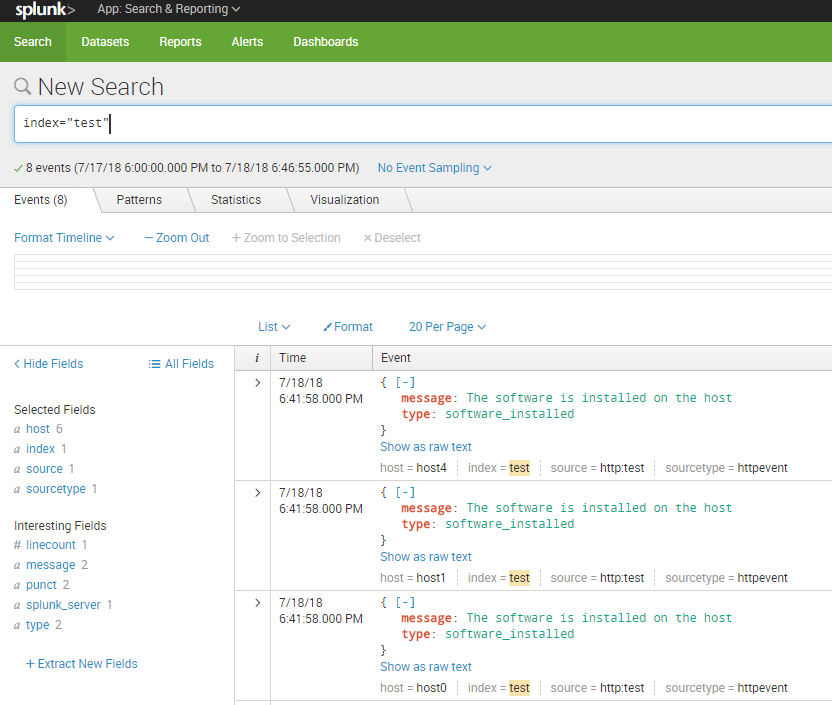
First of all, let’s send some generated data to Splunk.
I will create events for host1, host2 … host5 that are active. And events for host0, host1, host4 with installed software. Note the host0, that is not among the active hosts.
I will make make json events and send them to Splunk using HTTP Event Collector. You can read more about it in my post “Export anything to Splunk with HTTP Event Collector“.
Here is python code:
import json
import re
import time
import requests

package = ""
timestamp = int(time.time())

hosts_active = ["host1", "host2", "host3", "host4", "host5"]

for host in hosts_active:
    event = dict()
    event['time'] = timestamp
    event['host'] = host
    event['event'] =  {'type':'active_host', 'message':'The host seems active'}
    package = package + "\n" + json.dumps(event)

hosts_software_installed = ["host0", "host1", "host4"]

for host in hosts_software_installed:
    event = dict()
    event['time'] = timestamp
    event['host'] = host
    event['event'] =  {'type':'software_installed', 'message':'The software is installed on the host'}
    package = package + "\n" + json.dumps(event)

package = re.sub("^\n","", package)

print(package)

headers = {
    'Authorization': 'Splunk 6fa52c75-f0d8-4b44-a213-3f2440fb831q',
}

response = requests.post('https://[my-splunk-host]:8088/services/collector', headers=headers, data=package, verify=False)
print(response.text)
Output of the script:
{“host”: “host1”, “event”: {“message”: “The host seems active”, “type”: “active_host”}, “time”: 1531928518}
{“host”: “host2”, “event”: {“message”: “The host seems active”, “type”: “active_host”}, “time”: 1531928518}
{“host”: “host3”, “event”: {“message”: “The host seems active”, “type”: “active_host”}, “time”: 1531928518}
{“host”: “host4”, “event”: {“message”: “The host seems active”, “type”: “active_host”}, “time”: 1531928518}
{“host”: “host5”, “event”: {“message”: “The host seems active”, “type”: “active_host”}, “time”: 1531928518}
{“host”: “host0”, “event”: {“message”: “The software is installed on the host”, “type”: “software_installed”}, “time”: 1531928518}
{“host”: “host1”, “event”: {“message”: “The software is installed on the host”, “type”: “software_installed”}, “time”: 1531928518}
{“host”: “host4”, “event”: {“message”: “The software is installed on the host”, “type”: “software_installed”}, “time”: 1531928518}
So, I have this events in Splunk:
Tables
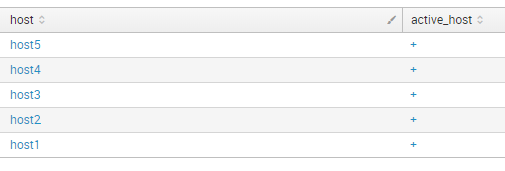
To get the whole picture, I want to make a table where in first column will be name of the host, in second will be “+” when the host is active, in third will be “+” if software was installed on this host.
I can create table for active hosts:
index="test" type="active_host" | table host active_host | eval active_host = "+" | uniq
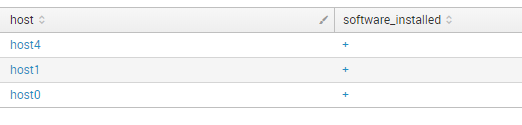
And create a table for installed software:
index="test" type="software_installed" | table host software_installed | eval software_installed = "+" | uniq
Now how to combine this tables?
Join?
I tried to use command join at first. But, as you can see, we lare loosing some hosts in this case:
index="test" type="active_host" | table host active_host | eval active_host = "+" | uniq | join type="inner" [ search index="test" type="software_installed" | table host software_installed | eval software_installed = "+" | uniq]
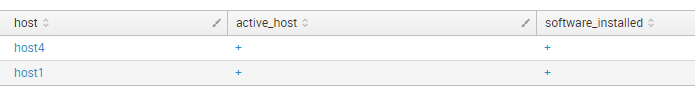
With join type “inner” you will get only the hosts that that exist in both tables =\
index="test" type="active_host" | table host active_host | eval active_host = "+" | uniq | join type="outer" [ search index="test" type="software_installed" | table host software_installed | eval software_installed = "+" | uniq]
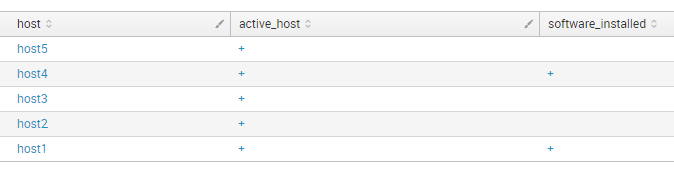
With join type “outer” (“left”) you will get only the hosts from first table =\. There is no host0, for example.
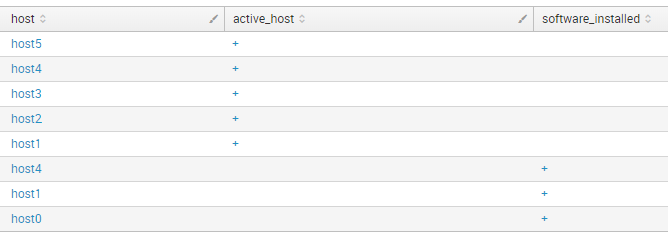
Append!
So, I decided to use append. that makes table like this.
index="test" type="active_host" | table host active_host | eval active_host = "+" | uniq | append [ search index="test" type="software_installed" | table host software_installed | eval software_installed = "+" | uniq]
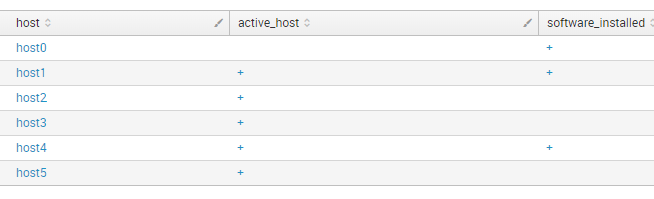
And then I can combine the lines using command stats first(*) as * by host.
index="test" type="active_host" | table host active_host | eval active_host = "+" | uniq | append [ search index="test" type="software_installed" | table host software_installed | eval software_installed = "+" | uniq] | stats first(*) as * by host
Warning! Output of append command in Splunk is limited to 50,000 rows max. Take care. You can change it in limits.conf (see maxresultrows param).
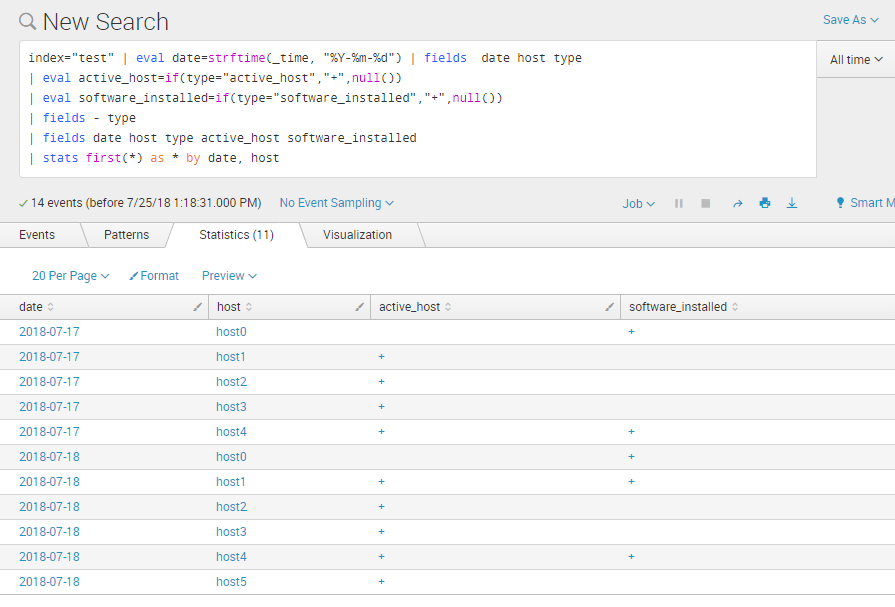
Upd 25.07.2018. In fact, you can get the same results without using append. Get all events at once. If they are in different indexes use index="test" OR index="test2" OR index="test3". Then check the type of event (or index name) and initialise required columns. Finally, delete the column you don’t need with field - <name>and combine the lines.
It works much faster and does not lose data due to command limitations:
index="test" | eval date=strftime(_time, "%Y-%m-%d") | fields date host type

| eval active_host=if(type="active_host","+",null())

| eval software_installed=if(type="software_installed","+",null())

| fields - type

| fields date host type active_host software_installed

| stats first(*) as * by date, host
END of upd.
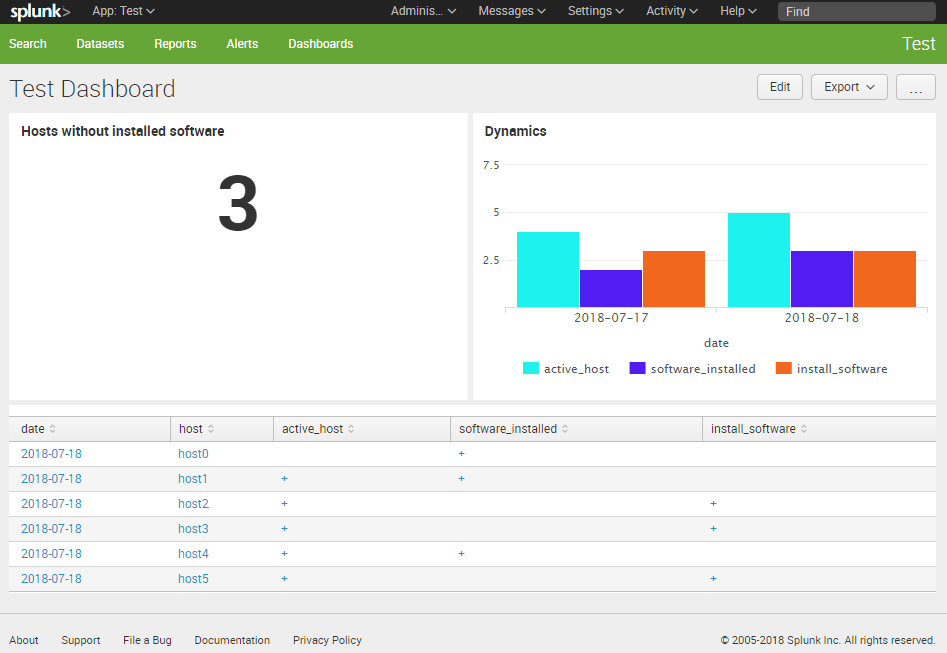
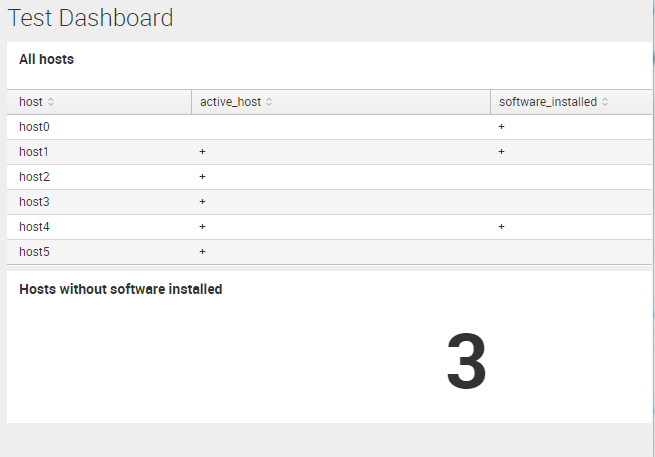
Finally, we have a table that shows us the whole picture of what is going on. We can filter from this table active hosts where we should install the software:
index="test" type="active_host" | table host active_host | eval active_host = "+" | uniq | append [ search index="test" type="software_installed" | table host software_installed | eval software_installed = "+" | uniq] | stats first(*) as * by host | where active_host="+" | where not software_installed="+"
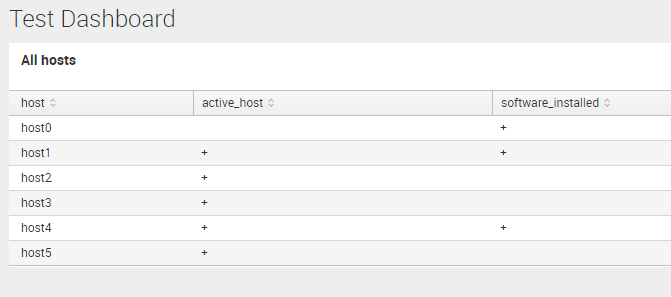
First dashboards
This table we can place on a dashboard. I create a new application, new dashboard and choose “Statistics Table”. And inputted the search. So, I’ve got this:
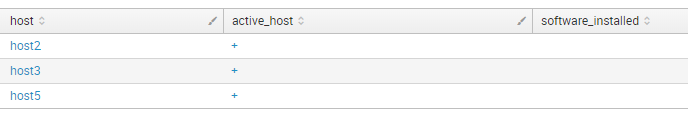
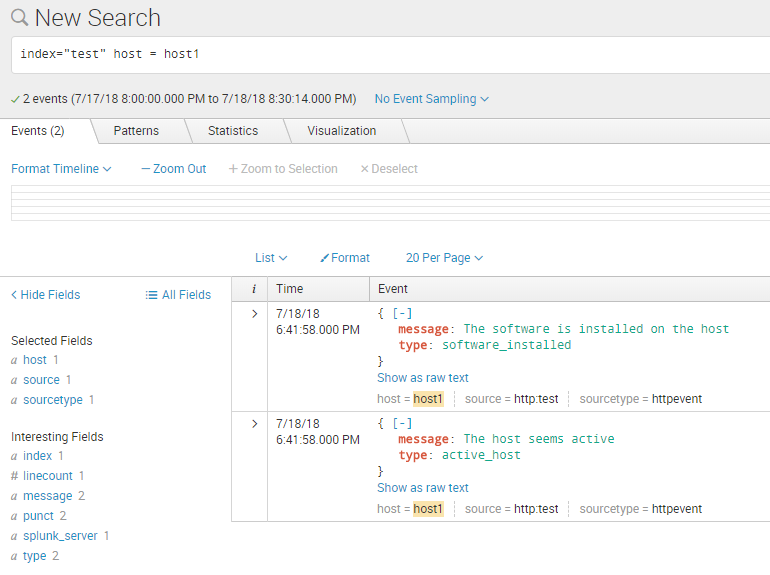
We can make this table clickable, so by pressing on the host it will make a search using this host name:
To use click value in search use token ‘$click.value2$’
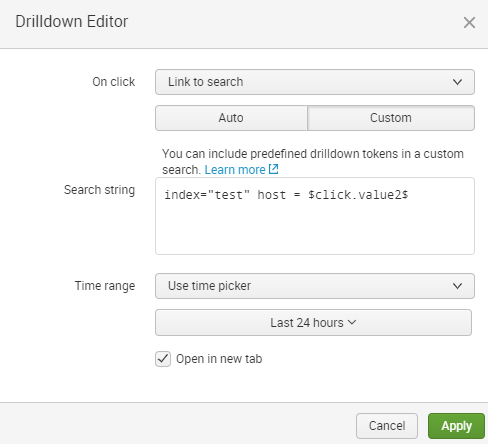
So by clicking on host1 I will get:
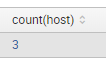
If we need to make an Informer about the current amount of hosts without software installed we can choose “Single Value” panel and add the search with `stats | table count(host)` at the end:
index="test" type="active_host" | table host active_host | eval active_host = "+" | uniq | append [ search index="test" type="software_installed" | table host software_installed | eval software_installed = "+" | uniq] | stats first(*) as * by host | where active_host="+" | where not software_installed="+" | stats | table count(host)
Dynamics and Column Charts
This works fine if we need show the current (last 24 hours) values. But what if we want to send this data to Splunk regularly and see the dynamics? For this we need to add more test data, for example for the previous day. At that day will be no host5 among active hosts and host3 among the hosts with software.
hosts_active = ["host1", "host2", "host3", "host4"]
hosts_software_installed = ["host0", "host4"]
timestamp = int(time.time()) - 24*60*60
So, I make the same tables with date value and make time period bigger:

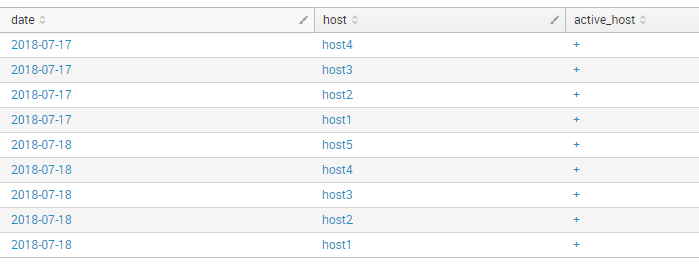
index="test" type="active_host" | eval date=strftime(_time, "%Y-%m-%d") | table date host active_host | eval active_host = "+" | uniq
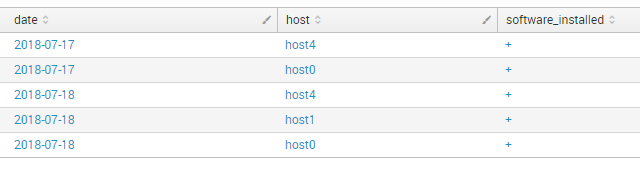
index="test" type="software_installed" | eval date=strftime(_time, "%Y-%m-%d") | table date host software_installed | eval software_installed = "+" | uniq
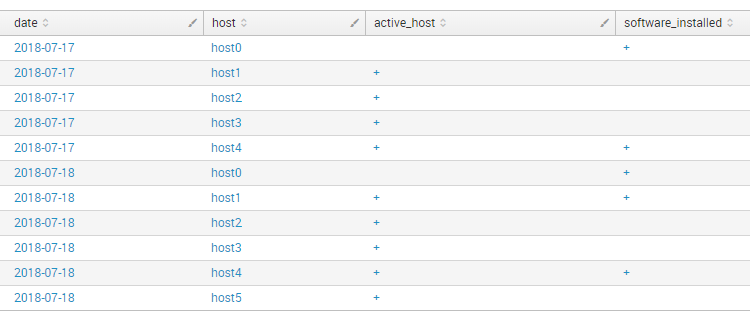
And combine the overall table:
index="test" type="active_host" | eval date=strftime(_time, "%Y-%m-%d") | table date host active_host | eval active_host = "+" | uniq | append [search index="test" type="software_installed" | eval date=strftime(_time, "%Y-%m-%d") | table date host software_installed | eval software_installed = "+" | uniq] | stats first(*) as * by date, host
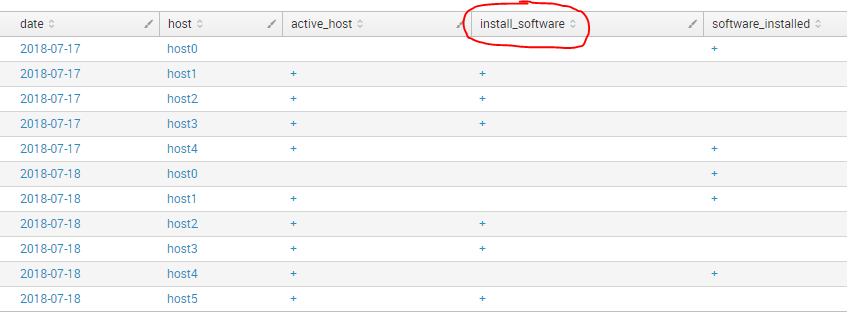
Adding a new column for the host where software installation is required:
index="test" type="active_host" | eval date=strftime(_time, "%Y-%m-%d") | table date host active_host | eval active_host = "+" | uniq | append [search index="test" type="software_installed" | eval date=strftime(_time, "%Y-%m-%d") | table date host software_installed | eval software_installed = "+" | uniq] | stats first(*) as * by date, host | eval install_software = if(not software_installed="+" and active_host="+", "+",null())
But for the dynamic I need not the actual values, but an amount of them, so:
- I delete the column
fields - host - I change “+” to 1 and empty value to “0”
eval active_host=if(active_host="+","1",active_host) | eval active_host=if(isnull(active_host),"0",active_host) - And sum all rows with stats:
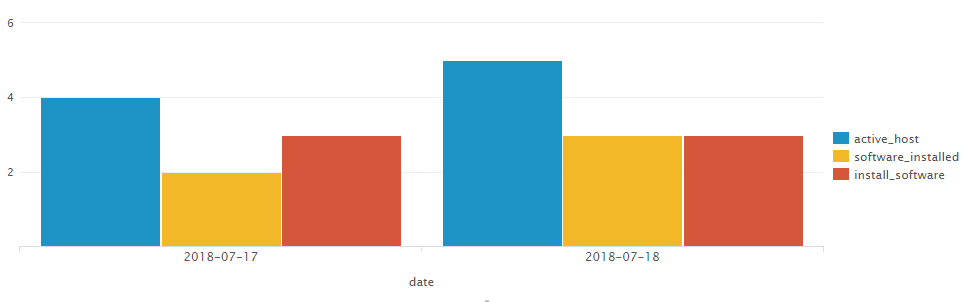
stats sum(active_host) as active_host, sum(install_software) as install_software, sum(software_installed) as software_installed by date
index="test" type="active_host" | eval date=strftime(_time, "%Y-%m-%d") | table date host active_host | eval active_host = "+" | uniq | append [search index="test" type="software_installed" | eval date=strftime(_time, "%Y-%m-%d") | table date host software_installed | eval software_installed = "+" | uniq] | stats first(*) as * by date, host | eval install_software = if(not software_installed="+" and active_host="+", "+",null()) | fields - host

| eval active_host=if(active_host="+","1",active_host) | eval active_host=if(isnull(active_host),"0",active_host)

| eval install_software=if(install_software="+","1",install_software) | eval install_software=if(isnull(install_software),"0",install_software)

| eval software_installed=if(software_installed="+","1",software_installed) | eval software_installed=if(isnull(software_installed),"0",software_installed)

| stats sum(active_host) as active_host, sum(install_software) as install_software,  sum(software_installed) as software_installed by date

I can change the order of columns using table command:
table date active_host software_installed install_software
The overall table can be presented as a Column Chart:
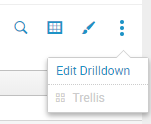
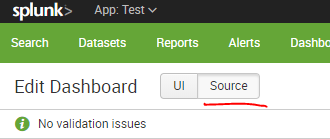
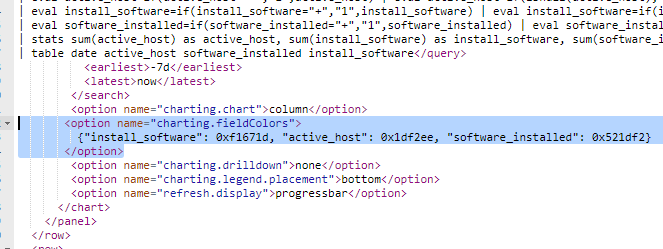
I can set different colors for the for the columns. I press Edit Dashboard -> source.
And add some options for the panel with Column Chart:
<option name="charting.fieldColors">

{"install_software": 0xf1671d, "active_host": 0x1df2ee, "software_installed": 0x521df2}

</option>
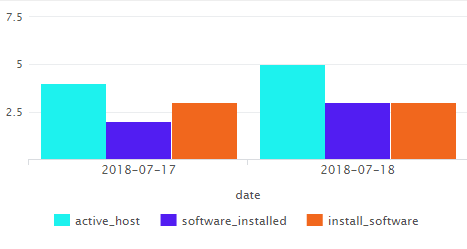
The diagram with new colors:
That’s it! 🙂

Hi! My name is Alexander and I am a Vulnerability Management specialist. You can read more about me here. Currently, the best way to follow me is my Telegram channel @avleonovcom. I update it more often than this site. If you haven’t used Telegram yet, give it a try. It’s great. You can discuss my posts or ask questions at @avleonovchat.
А всех русскоязычных я приглашаю в ещё один телеграмм канал @avleonovrus, первым делом теперь пишу туда.
Pingback: Sending FireEye HX data to Splunk | Alexander V. Leonov
Pingback: Sending tables from Atlassian Confluence to Splunk | Alexander V. Leonov
Pingback: How to create and manage Splunk dashboards via API | Alexander V. Leonov
Pingback: Making Splunk searches using REST API | Alexander V. Leonov
Pingback: Accelerating Splunk Dashboards with Base Searches and Saved Searches | Alexander V. Leonov
Pingback: Splunk Discovery Day Moscow 2018 | Alexander V. Leonov
Pingback: Why Asset Management is so important for Vulnerability Management and Infrastructure Security? | Alexander V. Leonov
Pingback: How to list, create, update and delete Grafana dashboards via API | Alexander V. Leonov