
How to create and manage Splunk dashboards via API. In the previous post “How to correlate different events in Splunk and make dashboards” I mentioned that Splunk dashboards can be presented in a simple XML form. You can generate it with some script and then copy-past it in Splunk GUI.
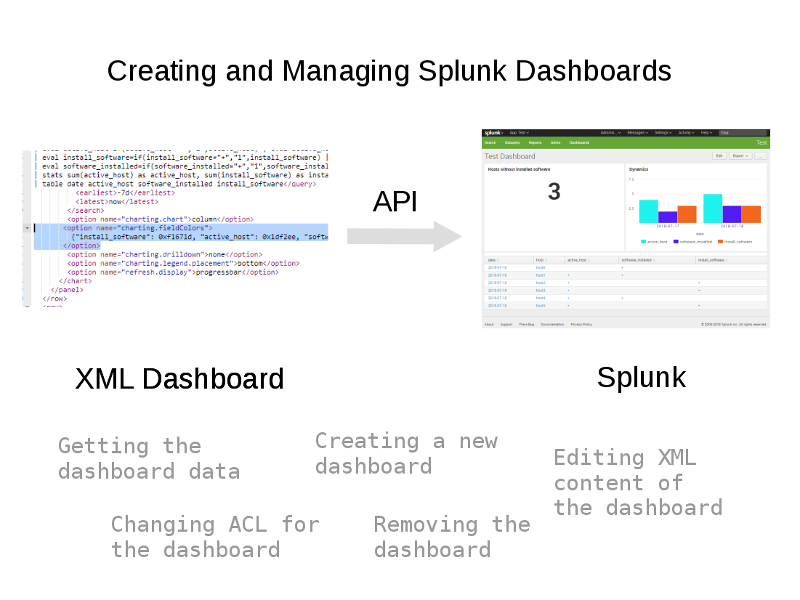
However, this manual operations can make the process of debugging dashboards really annoying. It would be much easier to send dashboard XML content to Splunk using Splunk API. And it is actually possible. 🙂
Listing the dashboards in Application
How to see what dashboards we have in the application labeled with “Test Application”?
First of all we should get it’s name (id) and the author of the application. Basically, I get all the applications with a GET request to `splunk_server + '/services/apps/local?count=-1` and filter the application with the right label:
import requests
import json

application_label = "Test Application"
splunk_server = "https://splunk.corporation.com:8089"
user = "splunk_user"
password = "splunk_user_password"

##########
app_name = ""
app_author = ""
data = {'output_mode': 'json'}
response = requests.get( splunk_server + '/services/apps/local?count=-1', data=data,
                             auth=(user, passwordl), verify=False)
for entry in json.loads(response.text)['entry']:
    if entry['content']['label'] == application_label:
        app_name = entry['name']
        app_author = entry['author']

print(app_name)
print(app_author)
Parameter count=-1 means that we want to get all entries at once without pagination. Also note that I set output_mode to json, so it would be easier to parse it.
Output:
test_application
nobody
Great! Now we can list all the dashboards of author “nobody” in application “test_application” with GET request to `splunk_server + '/servicesNS/' + app_author + '/' + app_name + '/data/ui/views/?count=-1`.
This servicesNS thing is not documented properly, but it seems to be the only way to work with most of Splunk elements. And it needs app_author and app_name in url, that’s why we got them at first.
So, the list of dashboards:
dashboards = dict()
data = {'output_mode': 'json'}
response = requests.get( splunk_server + '/servicesNS/' + app_author + '/' + app_name + '/data/ui/views/?count=-1', data=data,
                             auth=(user, password), verify=False)
for entry in json.loads(response.text)['entry']:
    if entry['content']['isDashboard'] == True and entry['content']['isVisible'] == True:
        dashboards[entry['content']['label']] = entry['name']
Output:
{u'Dashboard1': u'test1', u'Dashboard2': u'test2', u'Dashboard3': u'test3'}
Ok, we have three visible dashboards in the application.
Getting data from the dashboard
Now, let’s see what is inside the dashboard with the name (in fact it’s id) test2 from the test_application. We need to make GET request to `splunk_server + '/servicesNS/' + app_author + '/' + app_name + '/data/ui/views/' + dashboard_name`:
app_author = "nobody"
app_name = "test_application"
dashboard_name = "test2"

data = {'output_mode': 'json'}
response = requests.get( splunk_server + '/servicesNS/' + app_author + '/' + app_name + '/data/ui/views/' + dashboard_name, data=data,
                             auth=(user, password), verify=False)
print(json.loads(response.text))
Output:
{u'origin': u'https://splunk.corporation.com:8089/servicesNS/nobody/test_application/data/ui/views', u'updated': u'2018-09-26T20:03:55+03:00', u'links': {u'create': u'/servicesNS/nobody/test_application/data/ui/views/_new', u'_reload': u'/servicesNS/nobody/test_application/data/ui/views/_reload', u'_acl': u'/servicesNS/nobody/test_application/data/ui/views/_acl'}, u'generator': {u'version': u'7.0.2', u'build': u'03bbabbd5c0f'}, u'messages': [], u'paging': {u'total': 1, u'perPage': 30, u'offset': 0}, u'entry': [{u'updated': u'2018-09-12T12:28:04+03:00', u'name': u'test2', u'links': {u'alternate': u'/servicesNS/nobody/test_application/data/ui/views/test2', u'edit': u'/servicesNS/nobody/test_application/data/ui/views/test2', u'move': u'/servicesNS/nobody/test_application/data/ui/views/test2/move', u'list': u'/servicesNS/nobody/test_application/data/ui/views/test2', u'remove': u'/servicesNS/nobody/test_application/data/ui/views/test2', u'_reload': u'/servicesNS/nobody/test_application/data/ui/views/test2/_reload'}, u'author': u'a.leonov1', u'fields': {u'required': [u'eai:data'], u'optional': [u'eai:type'], u'wildcard': []}, u'acl': {u'can_change_perms': True, u'sharing': u'global', u'can_share_global': True, u'app': u'test_application', u'modifiable': True, u'can_list': True, u'can_share_user': True, u'can_share_app': True, u'perms': {u'read': [u'*'], u'write': [u'admin', u'power']}, u'removable': True, u'can_write': True, u'owner': u'a.leonov1'}, u'content': {u'eai:userName': u'nobody', u'eai:acl': None, u'eai:data': u'<dashboard><label>Dashboard2</label><row><panel>...</panel></row></dashboard>', u'label': u'AD User Accounts Dashboard', u'disabled': False, u'eai:digest': u'2a2aa2954edbb7d90d8239bd56968611', u'eai:appName': u'test_application', u'eai:type': u'views', u'rootNode': u'dashboard', u'isVisible': True, u'isDashboard': True}, u'id': u'https://splunk.corporation.com:8089/servicesNS/nobody/test_application/data/ui/views/test2'}]}
As you can see, the XML content of the dashboard is marked with bold.
Creating a new dashboard
To create a new dashboard we send a structure with dashboard name and XML content of the dashboard in a POST request to `splunk_server + '/servicesNS/' + app_author + '/' + app_name + '/data/ui/views/'`:
dashboard_name = "new_test_dashboard"
dashboard_xml_data = "<dashboard><label>New Test Dashboard</label><row><panel></panel></row></dashboard>"
data = {'output_mode': 'json',
        'name': dashboard_name,
        'eai:data': dashboard_xml_data
        }
response = requests.post( splunk_server + '/servicesNS/' + app_author + '/' + app_name + '/data/ui/views/', data=data,
                             auth=(user, password), verify=False)
Output:
{"links":{"create":"/servicesNS/nobody/test_application/data/ui/views/_new","_reload":"/servicesNS/nobody/test_application/data/ui/views/_reload","_acl":"/servicesNS/nobody/test_application/data/ui/views/_acl"},"origin":"https://splunk.corporation.com:8089/servicesNS/nobody/test_application/data/ui/views","updated":"2018-09-26T20:46:25+03:00","generator":{"build":"03bbabbd5c0f","version":"7.0.2"},"entry":[{"name":"new_test_dashboard","id":"https://splunk.corporation.com:8089/servicesNS/nobody/test_application/data/ui/views/new_test_dashboard","updated":"2018-09-26T20:46:25+03:00","links":{"alternate":"/servicesNS/nobody/test_application/data/ui/views/new_test_dashboard","list":"/servicesNS/nobody/test_application/data/ui/views/new_test_dashboard","_reload":"/servicesNS/nobody/test_application/data/ui/views/new_test_dashboard/_reload","edit":"/servicesNS/nobody/test_application/data/ui/views/new_test_dashboard","remove":"/servicesNS/nobody/test_application/data/ui/views/new_test_dashboard","move":"/servicesNS/nobody/test_application/data/ui/views/new_test_dashboard/move"},"author":"splunk_user","acl":{"app":"test_application","can_change_perms":true,"can_list":true,"can_share_app":true,"can_share_global":true,"can_share_user":true,"can_write":true,"modifiable":true,"owner":"splunk_user","perms":{"read":["*"],"write":["admin","power"]},"removable":true,"sharing":"app"},"content":{"disabled":false,"eai:acl":null,"eai:appName":"test_application","eai:data":"<dashboard><label>New Test Dashboard<\/label><row><panel><\/panel><\/row><\/dashboard>","eai:digest":"0e623966e5e8950be89f061725b97209","eai:type":"views","eai:userName":"nobody","isDashboard":true,"isVisible":true,"label":"New Test Dashboard","rootNode":"dashboard"}}],"paging":{"total":1,"perPage":30,"offset":0},"messages":[]}
If the dashboard with this name already exists in this application we will get an error:
{"messages":[{"type":"ERROR","text":"An object with name=new_test_dashboard already exists"}]}
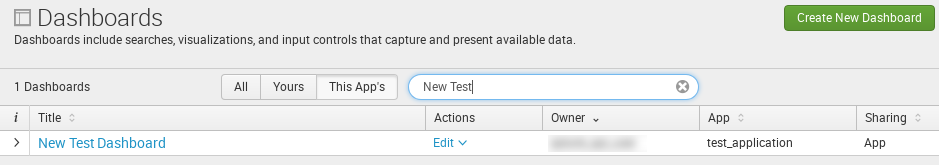
Here is a dashboard created via Splunk API in Splunk GUI:
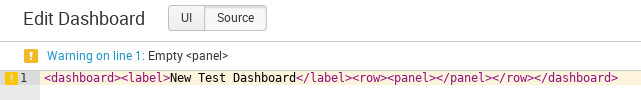
XML content of the dashboard in Splunk GUI:
Changing ACL for the dashboard
By default new dashboard was created with “splunk_user” owner and sharing value “App”. If we need to change it we can send new owner and sharing values in a POST request to `splunk_server + '/servicesNS/' + app_author + '/' + app_name + '/data/ui/views/' + dashboard_name +"/acl"`.
dashboard_name = "new_test_dashboard"
dashboard_xml_data = get_user_accounts_dashboard_xml(main_query_user_accounts, addon_query_user_accounts_sum)
data = {'output_mode': 'json',
        'owner': 'test_user',
        'sharing': 'global'
        }
response = requests.post( splunk_server + '/servicesNS/' + app_author + '/' + app_name + '/data/ui/views/' + dashboard_name +"/acl", data=data,
                             auth=(user, password), verify=False)
print(response.text)
Output:
{"links":{"create":"/servicesNS/nobody/test_application/data/ui/views/_new","_reload":"/servicesNS/nobody/test_application/data/ui/views/_reload","_acl":"/servicesNS/nobody/test_application/data/ui/views/_acl"},"origin":"https://splunk.corporation.com:8089/servicesNS/nobody/test_application/data/ui/views","updated":"2018-09-26T21:19:41+03:00","generator":{"build":"03bbabbd5c0f","version":"7.0.2"},"entry":[{"name":"new_test_dashboard","id":"https://splunk.corporation.com:8089/servicesNS/nobody/test_application/data/ui/views/new_test_dashboard","updated":"2018-09-26T21:19:41+03:00","links":{"alternate":"/servicesNS/nobody/test_application/data/ui/views/new_test_dashboard","list":"/servicesNS/nobody/test_application/data/ui/views/new_test_dashboard","_reload":"/servicesNS/nobody/test_application/data/ui/views/new_test_dashboard/_reload","edit":"/servicesNS/nobody/test_application/data/ui/views/new_test_dashboard","remove":"/servicesNS/nobody/test_application/data/ui/views/new_test_dashboard","move":"/servicesNS/nobody/test_application/data/ui/views/new_test_dashboard/move"},"author":"test_user","acl":{"app":"test_application","can_change_perms":true,"can_list":true,"can_share_app":true,"can_share_global":true,"can_share_user":true,"can_write":true,"modifiable":true,"owner":"test_user","perms":{"read":["*"],"write":["admin","power"]},"removable":true,"sharing":"global"},"content":{"eai:acl":null}}],"paging":{"total":1,"perPage":30,"offset":0},"messages":[]}
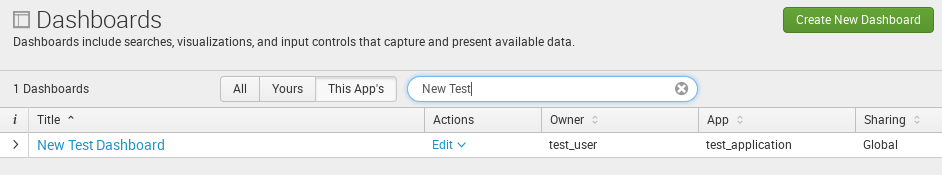
As you can see, owner was changed to “test_user” and sharing become “Global”:
Editing XML content of the dashboard
If we want to set a new XML content in the dashboard, we can send it in eai:data parameter of a POST request to `splunk_server + '/servicesNS/' + app_author + '/' + app_name + '/data/ui/views/' + dashboard_name`:
dashboard_name = "new_test_dashboard"
dashboard_xml_data = "<dashboard><label>New Test Dashboard</label><row><panel>123</panel></row></dashboard>"
data = {'output_mode': 'json',
        'eai:data': dashboard_xml_data,
        }
response = requests.post( splunk_server + '/servicesNS/' + app_author + '/' + app_name + '/data/ui/views/' + dashboard_name, data=data,
                             auth=(user, password), verify=False)
print(response.text)
Output:
{"links":{"create":"/servicesNS/nobody/test_application/data/ui/views/_new","_reload":"/servicesNS/nobody/test_application/data/ui/views/_reload","_acl":"/servicesNS/nobody/test_application/data/ui/views/_acl"},"origin":"https://splunk.corporation.com:8089/servicesNS/nobody/test_application/data/ui/views","updated":"2018-09-26T21:23:39+03:00","generator":{"build":"03bbabbd5c0f","version":"7.0.2"},"entry":[{"name":"new_test_dashboard","id":"https://splunk.corporation.com:8089/servicesNS/nobody/test_application/data/ui/views/new_test_dashboard","updated":"2018-09-26T21:23:39+03:00","links":{"alternate":"/servicesNS/nobody/test_application/data/ui/views/new_test_dashboard","list":"/servicesNS/nobody/test_application/data/ui/views/new_test_dashboard","_reload":"/servicesNS/nobody/test_application/data/ui/views/new_test_dashboard/_reload","edit":"/servicesNS/nobody/test_application/data/ui/views/new_test_dashboard","remove":"/servicesNS/nobody/test_application/data/ui/views/new_test_dashboard","move":"/servicesNS/nobody/test_application/data/ui/views/new_test_dashboard/move"},"author":"test_user","acl":{"app":"test_application","can_change_perms":true,"can_list":true,"can_share_app":true,"can_share_global":true,"can_share_user":true,"can_write":true,"modifiable":true,"owner":"test_user","perms":{"read":["*"],"write":["admin","power"]},"removable":true,"sharing":"global"},"content":{"disabled":false,"eai:acl":null,"eai:appName":"test_application","eai:data":"<dashboard><label>New Test Dashboard<\/label><row><panel>123<\/panel><\/row><\/dashboard>","eai:digest":"84064a01744724b9264fd718bf546c05","eai:type":"views","eai:userName":"nobody","isDashboard":true,"isVisible":true,"label":"New Test Dashboard","rootNode":"dashboard"}}],"paging":{"total":1,"perPage":30,"offset":0},"messages":[]}
Note the change in XML content in bold.
Removing the dashboard
And, of course, we can delete the dashboard by it’s name with DELETE request to the same URL `splunk_server + '/servicesNS/' + app_author + '/' + app_name + '/data/ui/views/' + dashboard_name`:
dashboard_name = "new_test_dashboard"
dashboard_xml_data = get_user_accounts_dashboard_xml(main_query_user_accounts, addon_query_user_accounts_sum)
data = {'output_mode': 'json',
        }
response = requests.delete( splunk_server + '/servicesNS/' + app_author + '/' + app_name + '/data/ui/views/' + dashboard_name, data=data,
                             auth=(user, password), verify=False)
print(response.text)
{"links":{"create":"/servicesNS/nobody/test_application/data/ui/views/_new","_reload":"/servicesNS/nobody/test_application/data/ui/views/_reload","_acl":"/servicesNS/nobody/test_application/data/ui/views/_acl"},"origin":"https://splunk.corporation.com:8089/servicesNS/nobody/test_application/data/ui/views","updated":"2018-09-26T21:26:27+03:00","generator":{"build":"03bbabbd5c0f","version":"7.0.2"},"entry":[],"paging":{"total":0,"perPage":30,"offset":0},"messages":[]}

Hi! My name is Alexander and I am a Vulnerability Management specialist. You can read more about me here. Currently, the best way to follow me is my Telegram channel @avleonovcom. I update it more often than this site. If you haven’t used Telegram yet, give it a try. It’s great. You can discuss my posts or ask questions at @avleonovchat.
А всех русскоязычных я приглашаю в ещё один телеграмм канал @avleonovrus, первым делом теперь пишу туда.
Do you think it;s possible to pass a token/value in the API to get dashboard content based on provided token?
Pingback: How to list, create, update and delete Grafana dashboards via API | Alexander V. Leonov
Pingback: Accelerating Splunk Dashboards with Base Searches and Saved Searches | Alexander V. Leonov