November 2023 – January 2024: New Vulristics Features, 3 Months of Microsoft Patch Tuesdays and Linux Patch Wednesdays, Year 2023 in Review. Hello everyone! It has been 3 months since the last episode. I spent most of this time improving my Vulristics project. So in this episode, let’s take a look at what’s been done.
Also, let’s take a look at the Microsoft Patch Tuesdays vulnerabilities, Linux Patch Wednesdays vulnerabilities and some other interesting vulnerabilities that have been released or updated in the last 3 months. Finally, I’d like to end this episode with a reflection on how my 2023 went and what I’d like to do in 2024.
Scanvus – my open source Vulnerability Scanner for Linux hosts and Docker images. Hello everyone! This video was recorded for the VMconf 22 Vulnerability Management conference, vmconf.pw. I will be talking about my open source project Scanvus. This project is already a year old and I use it almost every day.
Scanvus (Simple Credentialed Authenticated Network VUlnerability Scanner) is a vulnerability scanner for Linux. Currently for Ubuntu, Debian, CentOS, RedHat, Oracle Linux and Alpine distributions. But in general for any Linux distribution supported by the Vulners Linux API. The purpose of this utility is to get a list of packages and Linux distribution version from some source, make a request to an external vulnerabililty detection API (only Vulners Linux API is currently supported), and show the vulnerability report.
Scanvus can show vulnerabilities for
localhost
remote host via SSH
docker image
inventory file of a certain format
This utility greatly simplifies Linux infrastructure auditing. And besides, this is a project in which I can try to implement my ideas on vulnerability detection.
Example of output
For all targets the output is the same. It contains information about the target and the type of check. Then information about the OS version and the number of Linux packages. And finally, the actual information about vulnerabilities: how many vulnerabilities were found and the criticality levels of these vulnerabilities. The table shows the criticality level, bulletin ID, CVE list for the bulletin, and a comparison of the invulnerable fixed package version with the actual installed version.
This report is not the only way to present results. You can optionally export the results to JSON (OS inventory data, raw vulnerability data from Vulners Linux API or processed vulnerability data).
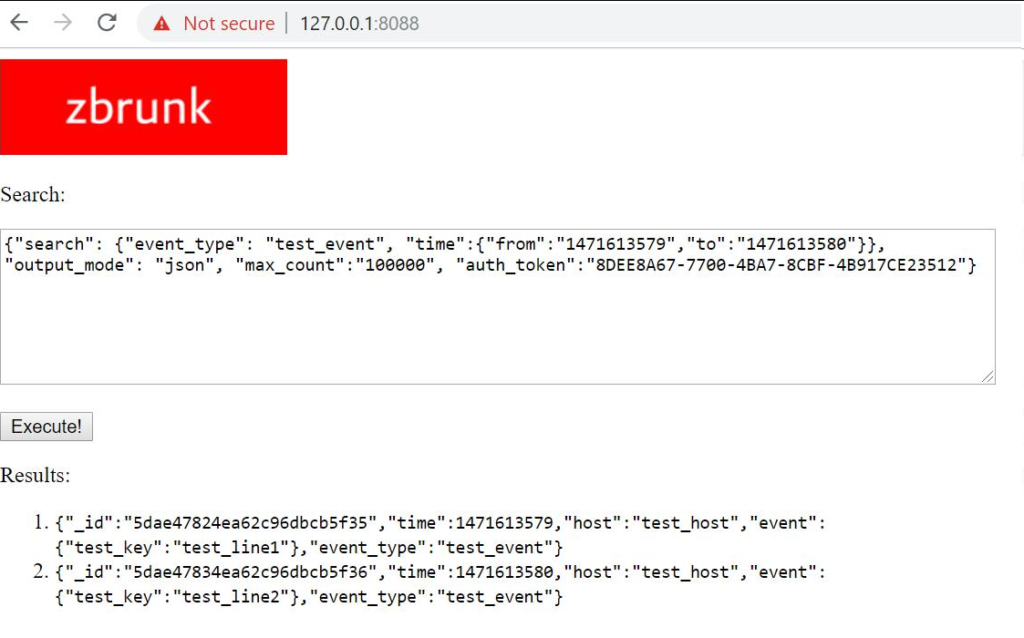
Zbrunk search launcher and event types statistics. I also changed the priorities. Now I think it would be better not to integrate with Grafana, but to create own dashboards and GUI. And to begin with, I created a simple interface for Searching (and Deleting) events.
upd. 16.12.2019
A small update on Zbrunk. First of all, I created a new API call that returns a list of object types in the database and number of this types for a certain period of time. Without it, debugging was rather inconvenient.
I also added some examples of working with Zbrunk http API from python3. Rewriting them from pure curl was not so trivial. ? Flask is rather moody, so I had to abandon the idea of making requests exactly the same as in Splunk. ? But the differences are cosmetic. It is now assumed that events will be passed to collector in valid json (not as a file with json events separated by ‘\n’). I also send all params of requests as json, not data. But for the compatibility reasons previous curl examples will also work. ?
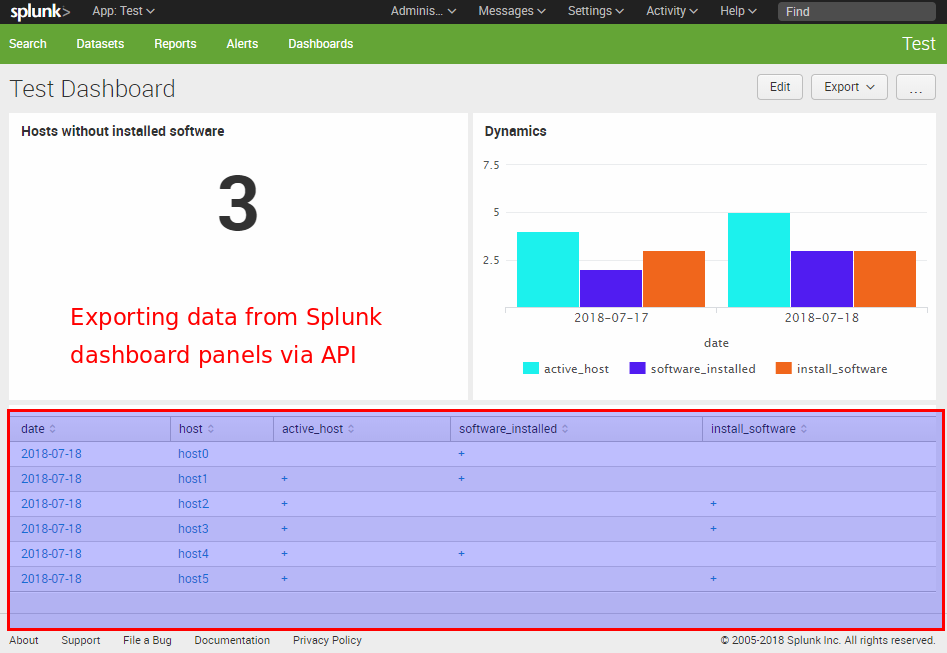
Retrieving data from Splunk Dashboard Panels via API. Fist of all, why might someone want to get data from the panels of a dashboard in Splunk? Why it might be useful? Well, if the script can process everything that human analyst sees on a Splunk dashboard, all the automation comes very natural. You just figure out what routine operations the analyst usually does using the dashboard and repeat his actions in the script as is. It may be the anomaly detection, remediation task creation, reaction on various events, whatever. It really opens endless possibilities without alerts, reports and all this stuff. I’m very excited about this. 🙂
Let’s say we have a Splunk dashboard and want to get data from the table panel using a python script. The problem is that the content of the table that we see is not actually stored anywhere. In fact it is the results of some search query, from the XML representation of the dashboard, executed by Splunk web GUI. To get this data we should execute the same search request.
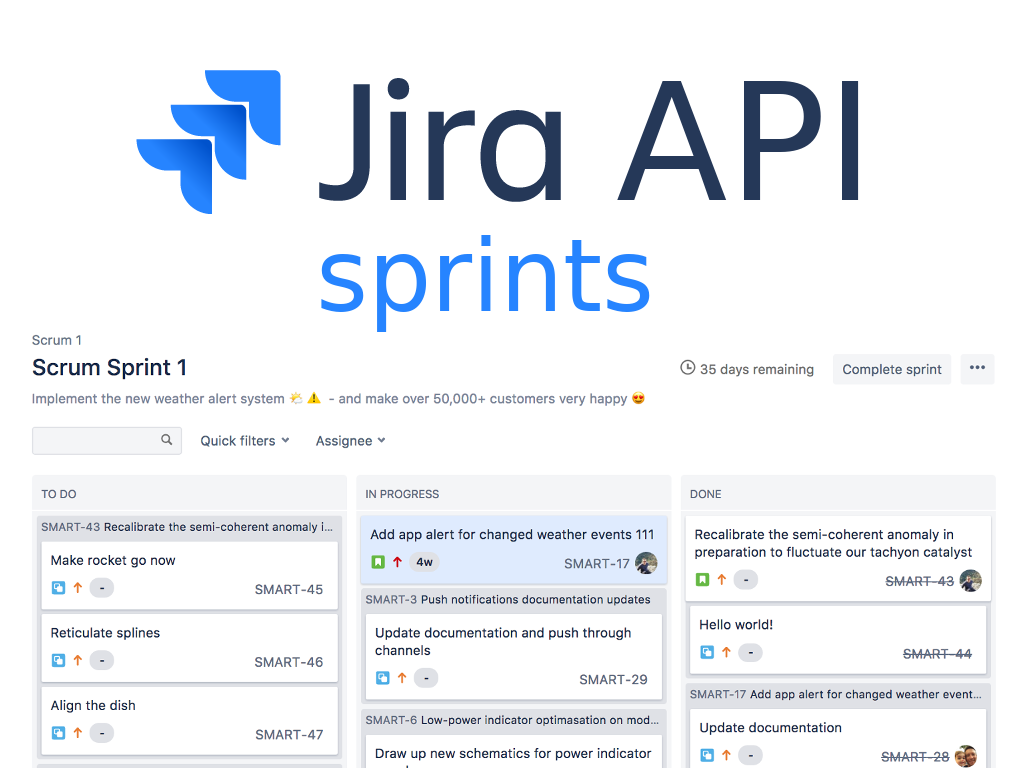
Managing JIRA Scrum Sprints using API. Atlassian Jira is a great tool for organizing Agile processes, especially Scrum. But managing Scrum Sprints manually using Jira web GUI maybe time consuming and annoying. So, I decided to automate some routine operations using JIRA API and Python.
I will use my domain account for authentication. First of all let’s see how to get Jira Scrum Board ID by it’s name and get all the Sprints related to the Board.
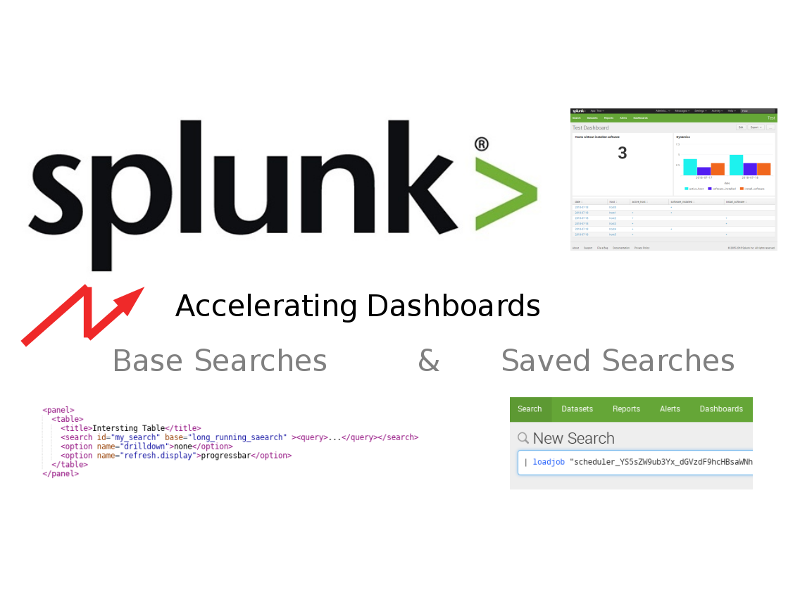
Accelerating Splunk Dashboards with Base Searches and Saved Searches. Let’s say we have a Splunk dashboard with multiple panels. Each panel has its own search request and all of these requests work independently and simultaneously. If they are complex enough, rendering the dashboard may take quite a long time and some panels may even fall by timeout.
How to avoid this? The first step is to understand how the searches are related. May be it is possible to select some base searches, and reuse their results in other child-searches. It’s also possible to get cached results from the “Saved Searches” (another name of Reports in Splunk GUI).
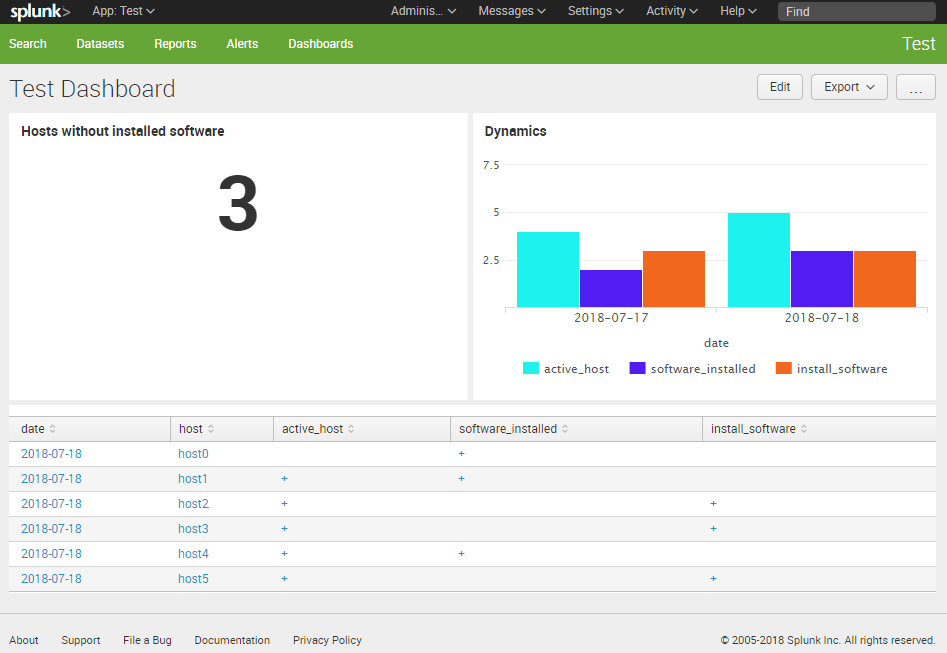
How to correlate different events in Splunk and make dashboards. Recently I’ve spent some time dealing with Splunk. Despite the fact that I have already done various Splunk searches before, for example in “Tracking software versions using Nessus and Splunk“, the correlation of different events in Splunk seems to be a very different task. And there not so many publicly available examples of this on the Internet. So, I decided to write a small post about it myself.
Disclaimer: I’m not a pro in Splunk. I don’t have an idea if I am doing this the right or in optimal way. 😉 I just learned some tricks, they worked for me well and I want to share it with you.
I will show the following case:
We have some active network hosts.
Some software product should be installed these hosts.
We will send “host X is active” and “software is installed on host X” events to the Splunk server.
We want to get some diagrams in Splunk that will show us on which hosts the software is installed and how number of such hosts is changing in time.
As you can see, the task is quite a trivial and it can be easily implemented in pure Python. But the idea is to make it in Splunk. 😉
This is my personal blog. The opinions expressed here are my own and not of my employer. All product names, logos, and brands are property of their respective owners. All company, product and service names used here for identification purposes only. Use of these names, logos, and brands does not imply endorsement. You can freely use materials of this site, but it would be nice if you place a link on https://avleonov.com and send message about it at me@avleonov.com or contact me any other way.