
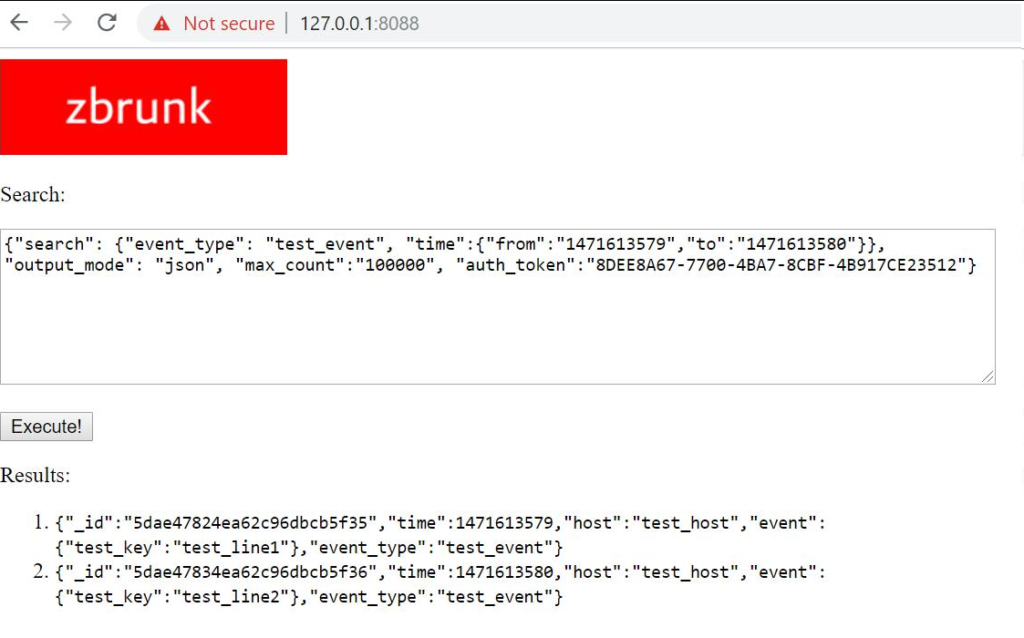
Zbrunk search launcher and event types statistics. I also changed the priorities. Now I think it would be better not to integrate with Grafana, but to create own dashboards and GUI. And to begin with, I created a simple interface for Searching (and Deleting) events.
upd. 16.12.2019
A small update on Zbrunk. First of all, I created a new API call that returns a list of object types in the database and number of this types for a certain period of time. Without it, debugging was rather inconvenient.
$ curl -k https://127.0.0.1:8088/services/searcher -d '{"get_types":"True", "search": {"time":{"from":"1471613579","to":"1471613580"}}, "output_mode": "json", "max_count":"10000000", "auth_token":"8DEE8A67-7700-4BA7-8CBF-4B917CE23512"}'

{"results": ["test_event"], "results_count": 1, "all_results_count": 0, "text": "Types found", "code": 0}
I also added some examples of working with Zbrunk http API from python3. Rewriting them from pure curl was not so trivial. ? Flask is rather moody, so I had to abandon the idea of making requests exactly the same as in Splunk. ? But the differences are cosmetic. It is now assumed that events will be passed to collector in valid json (not as a file with json events separated by ‘\n’). I also send all params of requests as json, not data. But for the compatibility reasons previous curl examples will also work. ?

Hi! My name is Alexander and I am a Vulnerability Management specialist. You can read more about me here. Currently, the best way to follow me is my Telegram channel @avleonovcom. I update it more often than this site. If you haven’t used Telegram yet, give it a try. It’s great. You can discuss my posts or ask questions at @avleonovchat.
А всех русскоязычных я приглашаю в ещё один телеграмм канал @avleonovrus, первым делом теперь пишу туда.