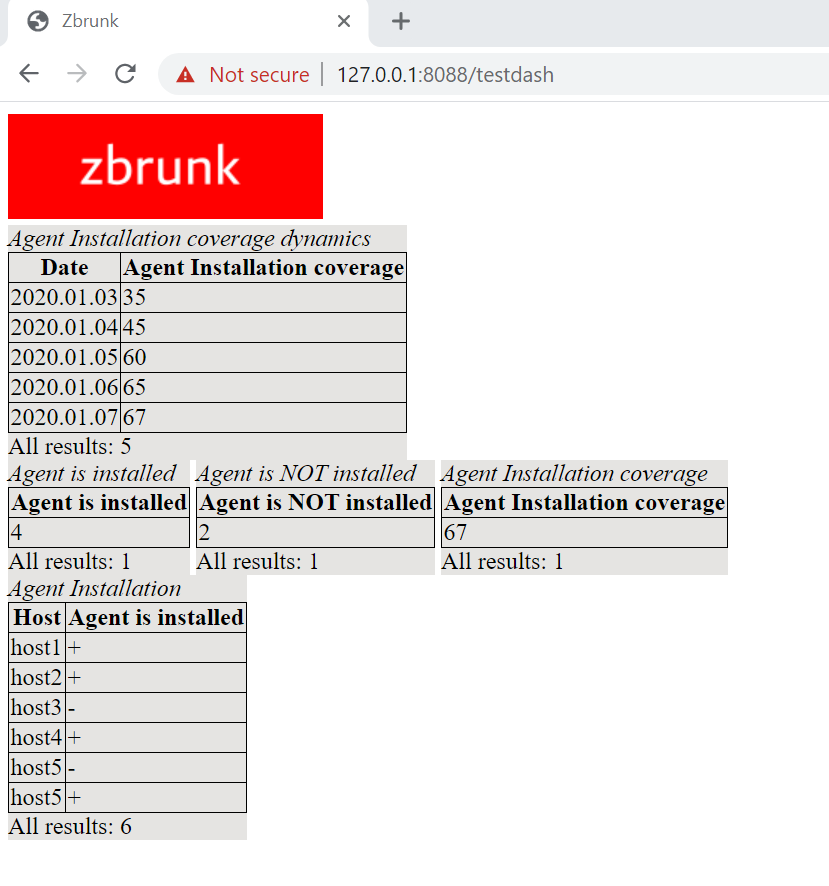
The first Zbrunk dashboard and other news. The long New Year holiday season in Russia was not in vain. I had time to work on Zbrunk. 😉 As you can see, I made my first dashboard and added other features.
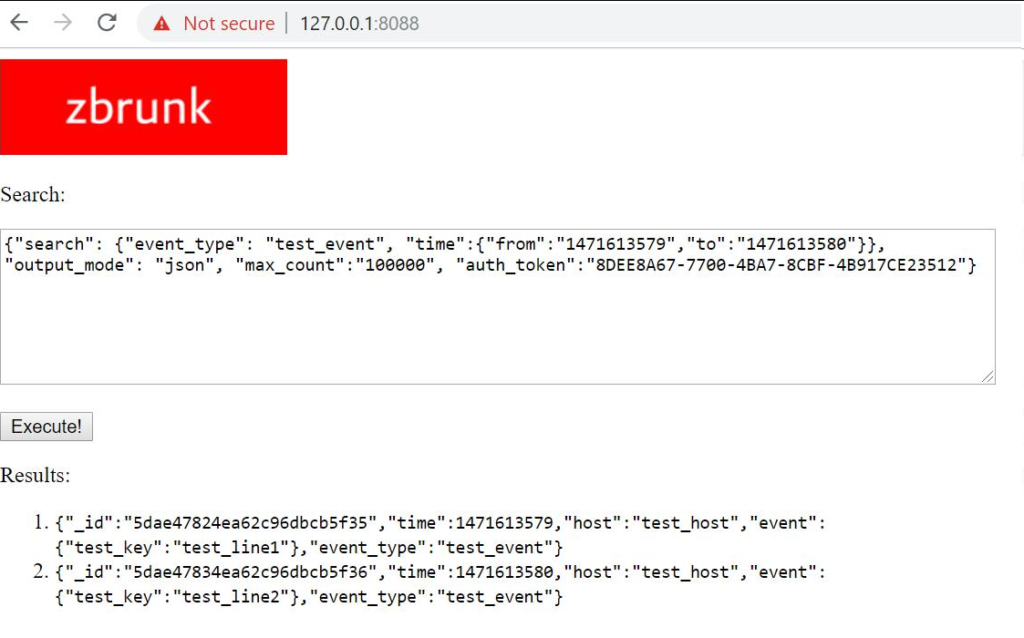
Zbrunk search launcher and event types statistics. I also changed the priorities. Now I think it would be better not to integrate with Grafana, but to create own dashboards and GUI. And to begin with, I created a simple interface for Searching (and Deleting) events.
upd. 16.12.2019
A small update on Zbrunk. First of all, I created a new API call that returns a list of object types in the database and number of this types for a certain period of time. Without it, debugging was rather inconvenient.
I also added some examples of working with Zbrunk http API from python3. Rewriting them from pure curl was not so trivial. ? Flask is rather moody, so I had to abandon the idea of making requests exactly the same as in Splunk. ? But the differences are cosmetic. It is now assumed that events will be passed to collector in valid json (not as a file with json events separated by ‘\n’). I also send all params of requests as json, not data. But for the compatibility reasons previous curl examples will also work. ?
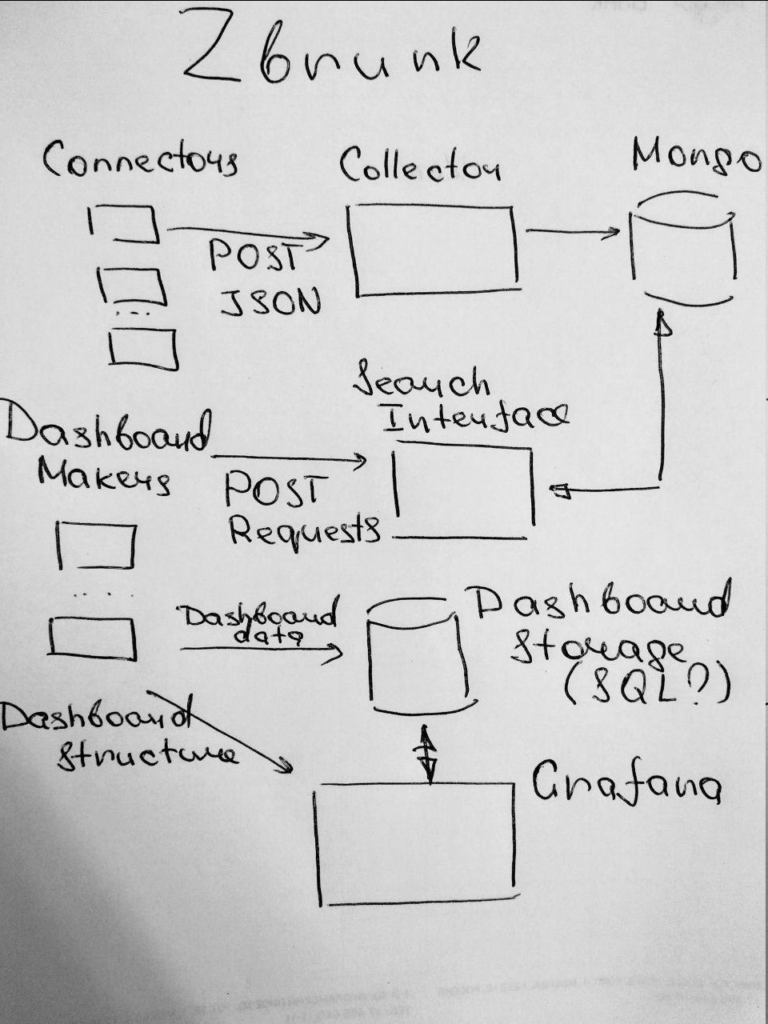
Zbrunk universal data analysis system. Zbrunk project (github) began almost like a joke. And in a way it is? In short, my friends and I decided to make an open-source (MIT license) tool, which will be a kind of alternative to Splunk for some specific tasks.
So, it will be possible to:
Put structured JSON events in Zbrunk using http collector API
Get the events from Zbrunk using http search API
Make information panels based on these search requests and place them on dashboards
Why is it necessary? Well, I’ve worked a lot with Splunk in recent years. I like the main concepts, and I think working with the events is a very effective and natural way of processing and presenting data. But for my tasks (Asset Management, Compliance Management, Vulnerability Management) with several hundred megabytes of raw data per day to process and dashboards that need to be updated once or several times a day Splunk felt like an overkill. You really don’t need such performance for these tasks.
And, considering the price, it only makes sense if your organization already uses Splunk for other tasks. After Splunk decision to leave Russian market, this became even more obvious, so many people began to look for alternatives for possible and, as far as possible, painless migration.
We are realistic, the performance and search capabilities of Zbrunk will be MUCH worse. It’s impossible to make such universal and effective solution as a pet project without any resources. So, don’t expect something that will process terabytes of logs in near real time, the goal is completely different. But if you want same basic tool to make dashboards, it worth a try. ?
Now, after first weekend of coding and planning it’s possible to send events to Zbrunk just like you do it using the Splunk HTTP Event Collector and they appear in MongoDB:
Thus, it will be very easy to use your existing custom connectors if you already have some. The next step is to make basic http search API, prepare dashboard data using these search requests and somehow show these dashboards, for example, in Grafana. Stay tuned and welcome to participate. ?
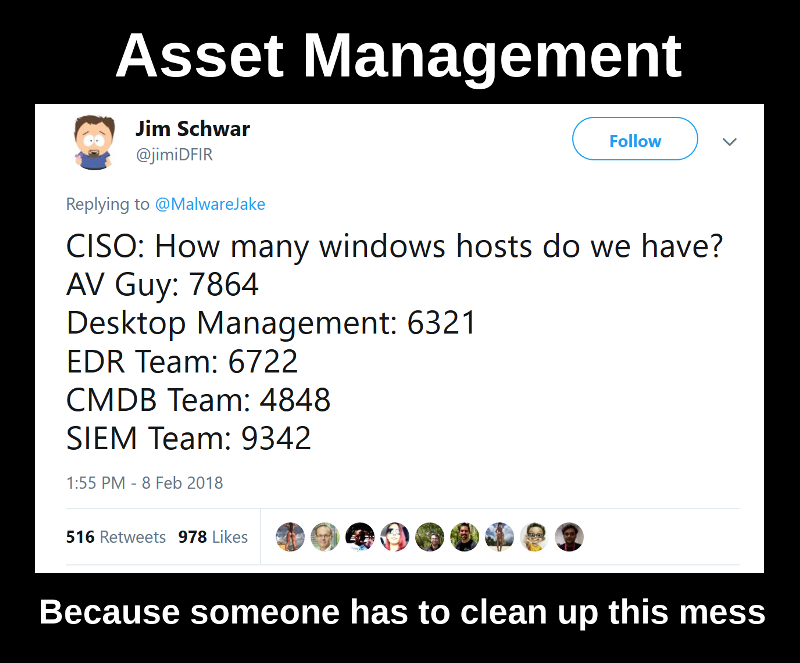
Why Asset Management is so important for Vulnerability Management and Infrastructure Security? When people ask me how should they start building Vulnerability Management process in their organization (well, sometimes it happens), I advice them to create an effective Asset Management process first. Because it’s the foundation of the whole Infrastructure Security.
The term “Asset Management” has different meanings and if you start to google it, you will get some results related mainly to finance sphere. I use this term as Qualys and Tenable. For me Asset Management is the process of dealing with network hosts.
So, what should you do in situation described in the tweet above, when you don’t know exactly how many Windows hosts you have in your corporate IT environment? And, more importantly, why do you need to know?
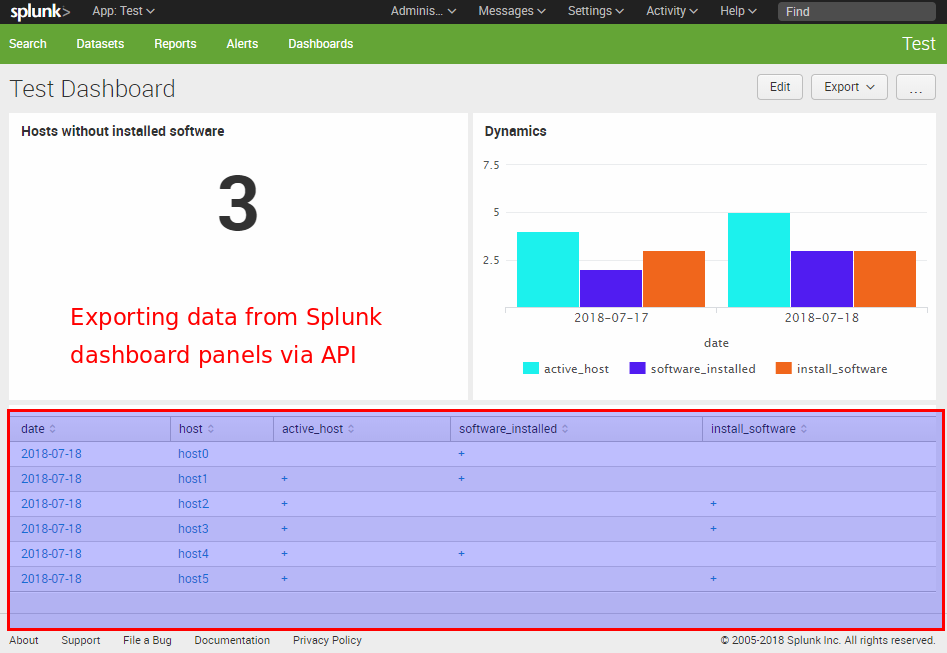
Retrieving data from Splunk Dashboard Panels via API. Fist of all, why might someone want to get data from the panels of a dashboard in Splunk? Why it might be useful? Well, if the script can process everything that human analyst sees on a Splunk dashboard, all the automation comes very natural. You just figure out what routine operations the analyst usually does using the dashboard and repeat his actions in the script as is. It may be the anomaly detection, remediation task creation, reaction on various events, whatever. It really opens endless possibilities without alerts, reports and all this stuff. I’m very excited about this. 🙂
Let’s say we have a Splunk dashboard and want to get data from the table panel using a python script. The problem is that the content of the table that we see is not actually stored anywhere. In fact it is the results of some search query, from the XML representation of the dashboard, executed by Splunk web GUI. To get this data we should execute the same search request.
VB-Trend 2018 Splunk Conference. Today I attended VB-Trend 2018 Splunk conference organized by system integrator VolgaBlob.
Video fragments from the event:
Comparing to “Splunk Discovery Day“, the conference was much smaller (less than 100 people), focused on technical aspects, Information Security and informal communication. And I need to say that there really was a lot of talks with colleagues from different companies, not only about Splunk, but also about Vulnerability Management, Application Security and Container Security.
This is my personal blog. The opinions expressed here are my own and not of my employer. All product names, logos, and brands are property of their respective owners. All company, product and service names used here for identification purposes only. Use of these names, logos, and brands does not imply endorsement. You can freely use materials of this site, but it would be nice if you place a link on https://avleonov.com and send message about it at me@avleonov.com or contact me any other way.