
The long New Year holiday season in Russia was not in vain. I had time to work on Zbrunk. 😉 As you can see, I made my first dashboard and added other features.
No more timestamps in code
I added functions to get Unix timestamps from lines in human-readable time format, e.g. “2019.12.10 13:00:00”.
Instead of a date, you can use words:
- Today
- Yesterday
- N days ago
- Beginning of Time
- End of Time
API requests will continue to support only Unix timestamps.
An even more universal HTTP Event collector
I made some changes to the data import. As you know, in the Splunk HTTP Event collector there is no need to set the index in which the events will be stored, because the collector is associated with authentication token. So, if you have many indexes, you have to deal with many authentication tokens. Strictly speaking, we have no indexes in Zbrunk, only event_type for each event. So, I went a little further and changed the behavior of connectors. Now you can set event_type in authentication token (like in Splunk) or directly in events.
# Authentication tokens for Zbrunk collector
collector_auth_tokens = {"8DEE8A67-7700-4BA7-8CBF-4B917CE2352B": {"event_type": "test_event"}, "8DEE8A67-7700-4BA7-8CBF-4B917CE23441": {}}
With the second token you can set event_type like this:
events = list()
events.append({"time": get_ts("Current"), "event_type": "test_event", "host": "test_host", "event": {"test_key": "test_line1"}})
events.append({"time": get_ts("Current"), "event_type": "test_event", "host": "test_host", "event": {"test_key": "test_line2"}})
collector_token = '8DEE8A67-7700-4BA7-8CBF-4B917CE23441'
print("Sending Events")
print("Results: " + str(send_to_collector(server=server, events=events, collector_token=collector_token)))
Tables as events
Tables in Zbrunk will be stored as events. I created an example script that creates several tables with test data, that I will show in test dashboard.
For example, I have a table:
Important Table

col1 col2
value1 value2
value3 value4
value4 value5
I will import it as “settings” event:
events.append({"time": get_ts("Current"), "event_type": "test_table_settings", "host": "test_host", "event": {"title":"Important Table", "col_order":["col1","col2"]}})And “content” events:
events.append({"time": get_ts("Current"), "event_type": "test_table_content", "host": "test_host", "event": {"content":{"col1":"value1", "col2":"valuе2"}}})
events.append({"time": get_ts("Current"), "event_type": "test_table_content", "host": "test_host", "event": {"content":{"col1":"value3", "col2":"valuе4"}}})
events.append({"time": get_ts("Current"), "event_type": "test_table_content", "host": "test_host", "event": {"content":{"col1":"value5", "col2":"valuе6"}}})
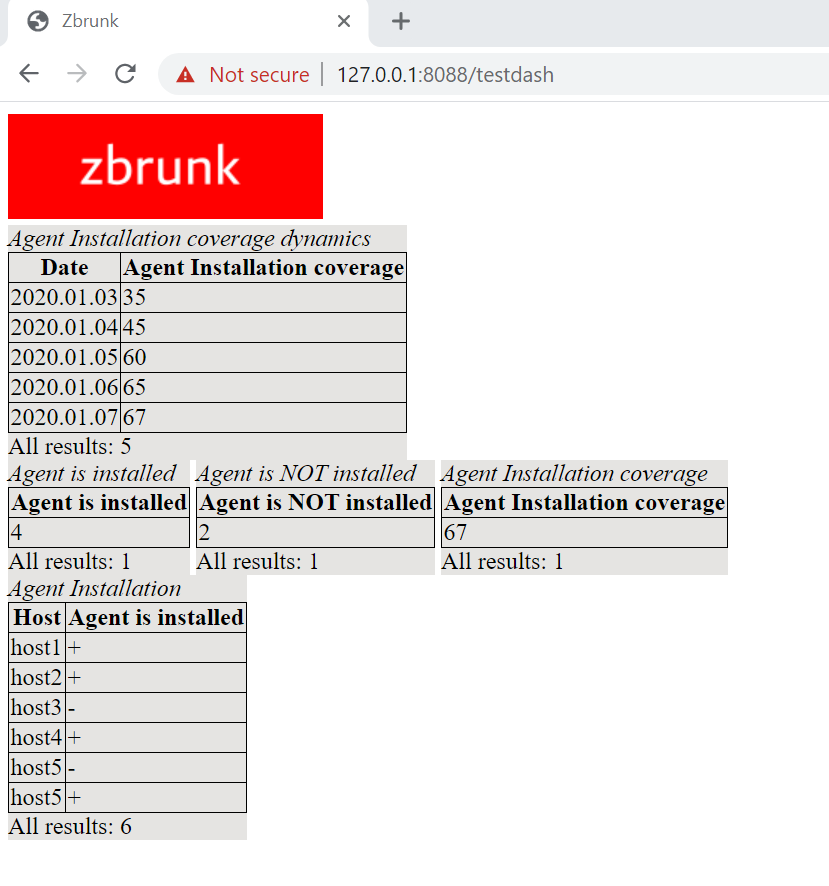
Dashboards
Finally, I created my first Zbrunk dashboard 🙂 I needed js scripts to access the API and get the tables stored as events, and then draw the tables based on this data. So now I have this test “Agent Installation Tasks” dashboard.
All the data is currently displayed as tables. As you know, in Splunk, each widget is also a table that can be displayed in various forms. So, I need to do some more JavaScript coding to make the charts out of this tables.
For me, making the front-end part is the most challenging and painful. 🙂 So, if you want to take part in this open source project, you are welcome to participate.

Hi! My name is Alexander and I am a Vulnerability Management specialist. You can read more about me here. Currently, the best way to follow me is my Telegram channel @avleonovcom. I update it more often than this site. If you haven’t used Telegram yet, give it a try. It’s great. You can discuss my posts or ask questions at @avleonovchat.
А всех русскоязычных я приглашаю в ещё один телеграмм канал @avleonovrus, первым делом теперь пишу туда.