
Let’s say you have already exported scan results from Nessus or Tenable SecurityCenter to Splunk using HTTP event connector, or in some other way. And you see that some critical software vulnerability was published. For example, this month Jira critical vulnerability. How to find out, do we have vulnerable servers in our infrastructure or not?
Of course we can start a new Nessus scan to detect vulnerable hosts. However, Nessus plugin for this particular vulnerability may be released with a big latency and you will not find this vulnerability in your scans. So, it’s may be faster just to search for detected Jira servers in available scan results using Splunk searching mechanism.
Splunk search
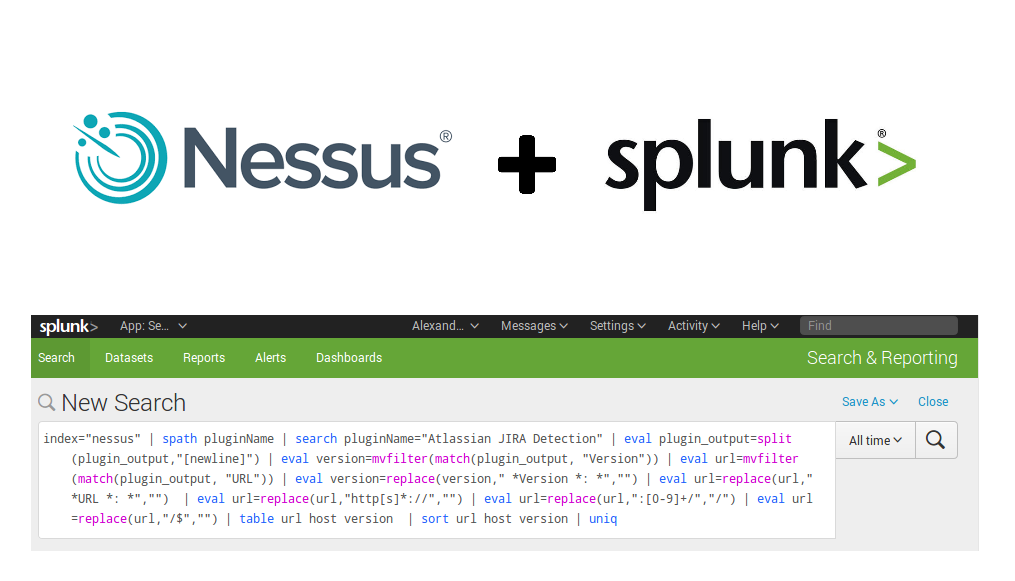
So, here is a complete Splunk search I used to find all versions of jira in Nessus scan results:
index="nessus" | spath pluginName | search pluginName="Atlassian JIRA Detection" | eval plugin_output=split(plugin_output,"[newline]") | eval version=mvfilter(match(plugin_output, "Version")) | eval url=mvfilter(match(plugin_output, "URL")) | eval version=replace(version," *Version *: *","") | eval url=replace(url," *URL *: *","") | eval url=replace(url,"http[s]*://","") | eval url=replace(url,":[0-9]+/","/") | eval url=replace(url,"/$","") | table url host version | sort url host version | uniq
It’s not the best programming style for Splunk search requests, but maybe it will give somebody an idea how do such things.
So, we have events in format I showed in “Export anything to Splunk“. I need plugin with name “Atlassian JIRA Detection”. This part of request will filter events from the Nessus Splunk index by Nessus plugin name:
index="nessus" | spath pluginName | search pluginName="Atlassian JIRA Detection"
Ok, Jira version is presented in Nessus plugin output. It look like this:
plugin_output: The following instance of Atlassian JIRA was detected on the remote host :[newline] Version : 6.4.11[newline] URL : https://jira.corporation.com/
I made “\n” substitution to “[newline]” because it was easier to make Json for Splunk in such way. The Idea is that you will have some multi-line text output where lines are divided with some symbol. How to get url and Jira version from it?
Well, you can make an array from this output splitting it by “[newline]”:
| eval plugin_output=split(plugin_output,"[newline]")
Now plugin_output is an array. We can copy elements of this array that match some regex to a new parameter of Splunk event.
For line with Version:
| eval version=mvfilter(match(plugin_output, "Version"))
And for line with URL:
| eval url=mvfilter(match(plugin_output, "URL"))
So now we can say, that we want a table with url, ip adress (parameter host), and Jira version:
| table url host version
Now we will have something like this in output:
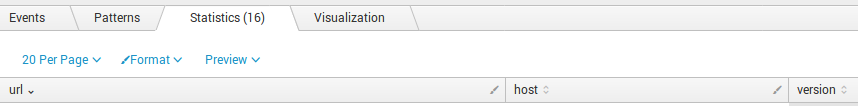
url|host|version
URL : http://jira.corporation.com:8080/|2.33.213.15|Version : 6.4.11
URL : https://jira.corporation.com/|2.33.213.15|Version : 6.4.11
URL : http://jira2.corporation.com:8080/|2.33.213.15|Version : 7.5
URL : https://jira2.corporation.com/|2.33.213.15|Version : 7.5
Looks nice, but it would be better to clean up fields with url and version. To delete “Version : ” I added this replace commands:
| eval version=replace(version," *Version *: *","")
Some more replaces to delete “URL : “, protocol and port:
| eval url=replace(url," *URL *: *","") | eval url=replace(url,"http[s]*://","") | eval url=replace(url,":[0-9]+/","/") | eval url=replace(url,"/$","")
Now it looks like this:
url|host|version
jira.corporation.com|2.33.213.15|6.4.11
jira.corporation.com|2.33.213.15|6.4.11
jira2.corporation.com|2.33.213.15|7.5
jira2.corporation.com|2.33.213.15|7.5
Let’s make sort uniq for the table:
| sort url host version | uniq
And the final result looks like this:
url|host|version
jira.corporation.com|2.33.213.15|6.4.11
http://jira2.corporation.com|2.33.213.15|7.5
Export to csv
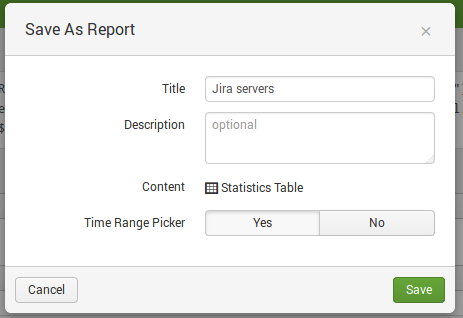
To export our table we need to make a new report:

Add some title:
Report has been created:
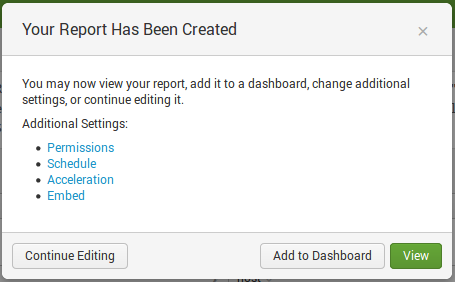
And now when we can press “Export” button:
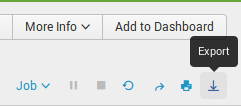
And export report in various formats:
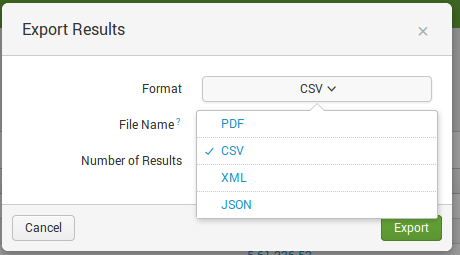
I chose csv:
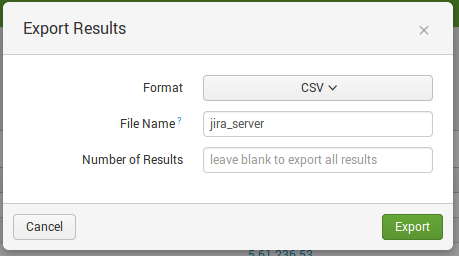
Here it is:
url,host,version
“jira.corporation.com”,”2.33.213.15″,”6.4.11″
“jira.corporation.com”,”2.33.213.15″,”7.5″

Hi! My name is Alexander and I am a Vulnerability Management specialist. You can read more about me here. Currently, the best way to follow me is my Telegram channel @avleonovcom. I update it more often than this site. If you haven’t used Telegram yet, give it a try. It’s great. You can discuss my posts or ask questions at @avleonovchat.
А всех русскоязычных я приглашаю в ещё один телеграмм канал @avleonovrus, первым делом теперь пишу туда.
Pingback: Splunk search REST API | Alexander V. Leonov
Pingback: Kenna Security: Analyzing Vulnerability Scan data | Alexander V. Leonov
Pingback: Vulchain scan workflow and search queries | Alexander V. Leonov
Pingback: How to correlate different events in Splunk and make dashboards | Alexander V. Leonov
Pingback: How to list, create, update and delete Grafana dashboards via API | Alexander V. Leonov