
I’ve been following Kenna Security (before 2015 Risk I/O) for a pretty long time. Mainly, because they do the things I do on a daily basis: analyse various vulnerability scan results and feeds, and prioritize detected vulnerabilities for further mitigation. The only difference is that my scripts and reports are highly specific for my employer’s infrastructure and needs. And guys from Kenna team make a standardized scalable cloud solution that should be suitable for everyone.
I think their niche is really great. They do not compete directly with Vulnerability Management vendors. They can be partners with any of them, bringing additional features to the customers. Perfect win-win combination. That’s why Kenna speakers regularly participate in joint webinars with VM vendors.
I couldn’t lose a great opportunity to see Kenna Security service in action. 😉
In this post I will try to make a very brief review of Kenna functionality and formulate pros and cons of the solution.
When you submit trial request at https://www.eu.kennasecurity.com/signup (or https://app.kennasecurity.com/signup if you are not in Europe) you will get a link to your company account:
https://corporation.eu.kennasecurity.com/
The login screen will look like this:
Here you can see all the connectors that can be used to import Vulnerability Scanning and Asset data to Kenna:
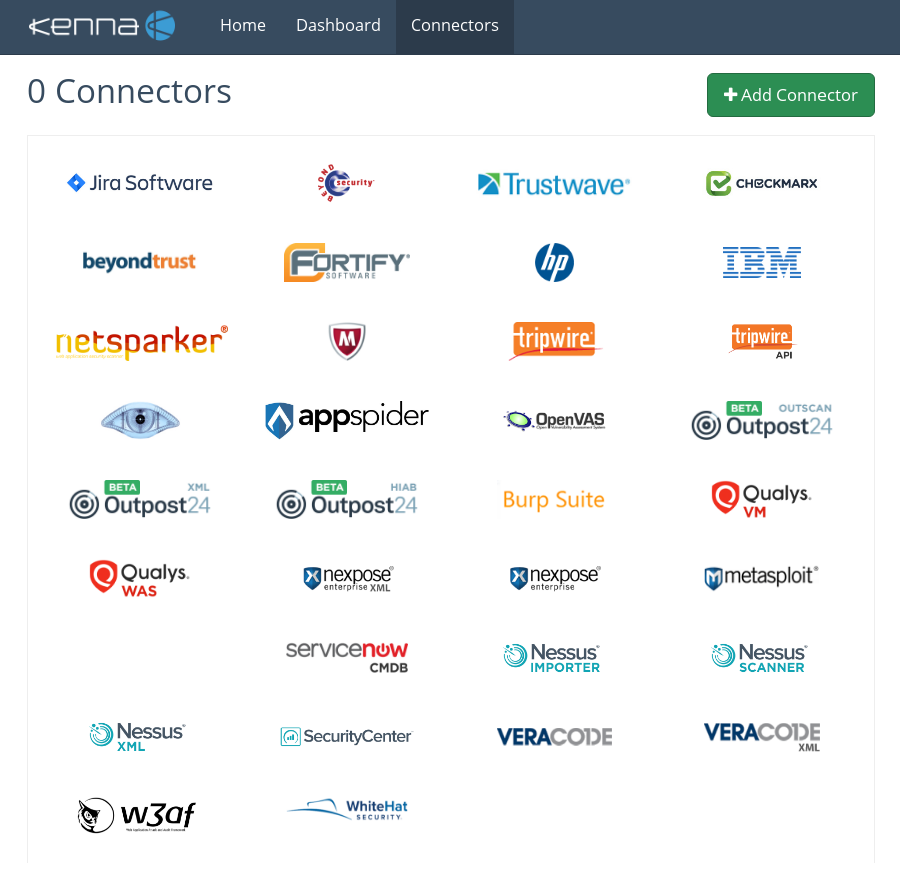
As you can see it supports all the main Vulnerability Management solutions, as well as AST, ticketing systems and CMDB.
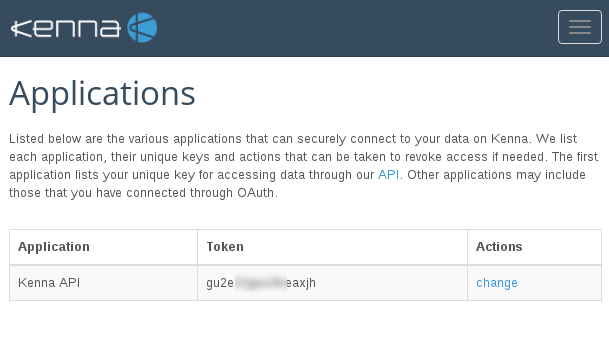
You can use Rest API to upload the data. Here is the interface for generating application keys.
I will not show interface on my real scan data, because it still can be sensitive, even after masking IPs and FQDNs. I made several screenshots from Kenna videos on youtube. Sorry for the quality.
Filters
The most interesting feature of Kenna, in my opinion, is the set of vulnerability filters:
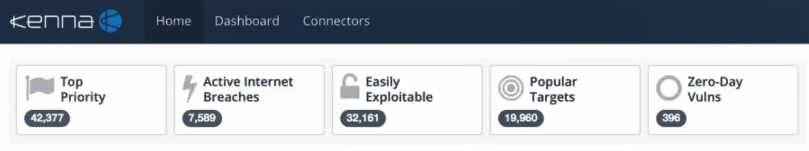
- Top Priority – vulnerabilities, that have the highest priority. You can flag them manually as well.
- Active Internet Breaches – vulnerabilities that attackers actively use at the current time.
- Easily Exploitable – vulnerabilities with known exploits.
- Malware Exploitable – vulnerabilities that are actively exploited by different kind of malware (including viruses and ransomware).
- Popular Targets – vulnerabilities that many Kena customers have.
- Zero-Day Vulns – vulnerabilities without vendor’s fixes.
If you choose one or several filters you will get different sets of vulnerabilities and assets bellow.
Assets
For each Asset you can see the following fields: Score (Max Vulnerability Score * Asset Priority), Locator (IP or FQDN), OS. Additional fields for Asset: Priority, Last Seen, Tags, Owner, Created.
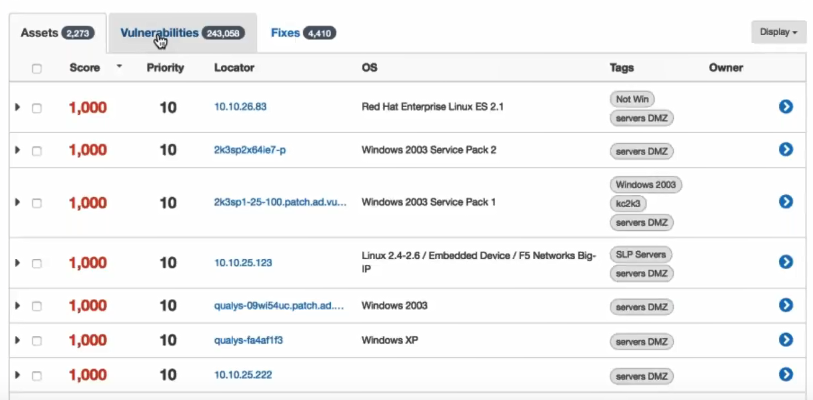
If you press on a host name or on a blue arrow, you will get Vulnerability list for the Asset.
Vulnerabilities
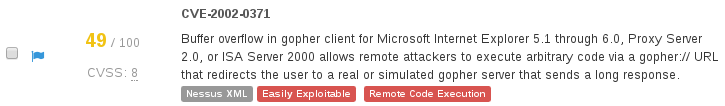
The main columns on Vulnerabilities tab: Score (CVSS * 10), Name and Asset. Additional columns: CVE Description, Tags, Scanner IDs, Unique Identifiers, Fix Published, Found, Last Seen, Port, Closed, Due Date, Status, Scanner Score, Service Ticket, Notes, Created.
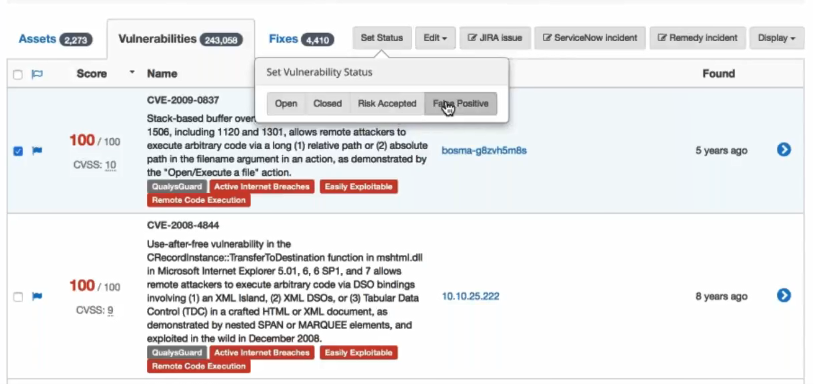
As you see on the screenshot, there are tags that show the source of vulnerability (Qualys) and characteristics of in the terms the filters that were shown above.
If you press on a blue arrow, you can see vulnerability data: Description, Fix, Known Exploits, and the actual data from detection plugin.
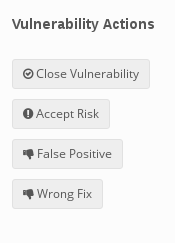
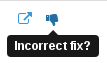
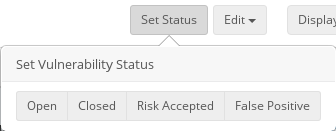
Every vulnerability can be marked as “closed”, “risk accepted”, “false positive” or “wrong fix”.
Note, that ALL vulnerabilities presented here as CVE ids. This can be a problem, I will mention it in Pros & Cons.
Fixes
Fixes tab is the most controversial part of the interface. As I understand, they look on the the list of all detected CVEs and try to suggest the fix, that will mitigate maximum of vulnerabilities on maximum of hosts. Several tabs are supported: Diagnosis, Consequence, Solution, CVEs Addressed, Assets Affected, Scanner IDs.
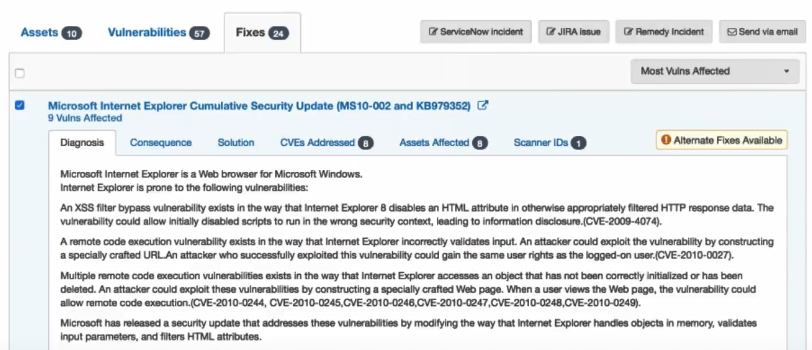
The problem is that Fixes are related to CVEs and not the host type. Kenna can show the fix for some specific system, for example “IBM Security AppScan Enterprise” even if you don’t have such hosts in your environment. It’s very strange.
Search interface
I want to mention great Search interface that support Elasticsearch-style requests.
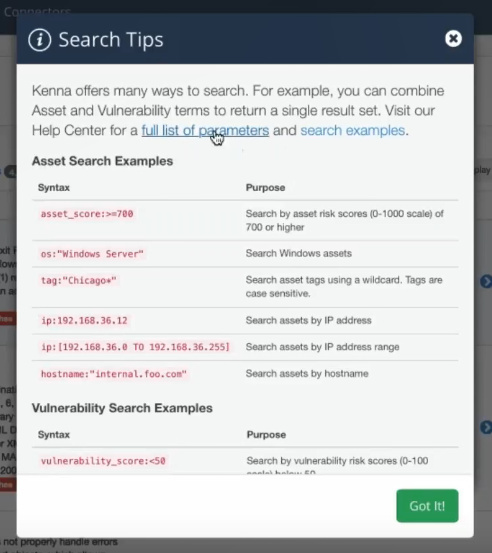
There are also great GUI filters for groups, assets and vulnerabilities. It will be hard to mention all the parameters that you can use for filtering. Very powerful thing, like Splunk, but highly specialized for Vulnerability data.
Risk Meters
Kenna also has a pretty cool dashboards that you can use to visualize the security state for each asset group.
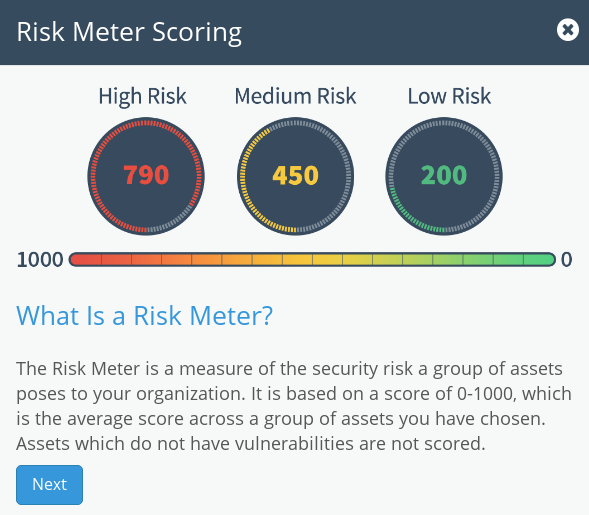
They count Risk level using some secret method. If you press on this indicator you can see the criticality of vulnerabilities in the Asset group. Cute. 🙂

Pros & Cons
+ Works out of the box
In my opinion, Kenna is a great solution if you need an instrument for analyzing the current state of security in the organisation. Upload the data, wait couple of minutes and all become visible and searchable. Kenna has a great, very fast highly configurable UI. It’s a very powerful way to make search requests. And you don’t need to write any scripts for this!
+ Exploit, malware and 0 day feeds
This data is crucial for correct vulnerability prioritization. Malware and 0day data feeds are especially rare. Information about exploits is partly available directly in the scanner (see “Exploitability attributes of Nessus plugins: good, bad and Vulners“).
However, it’s not enough to know that exploit for vulnerability exists. It’s useful to have formalized description: what the exploit can actually do, on what platforms, was this exploit tested in some trusted lab or not. It’s great if the vulnerability can be exploited from the user interface, like in ERPScan (see “ERPScan SAP security scanner“). I hope Kenna Team will work in this direction as well.
+ Intuitive API
You can import data in Kenna using great REST API. I am going to make a separate post on this. Upd. Here it is: “Kenna Security: Connectors and REST API”
+ Time scale reports
The UI of Kenna looks like you exported your scan data in SIEM. Compare it with post “Tracking software versions using Nessus and Splunk“. As for me, I’m a big fun of dynamical reports (read “ZeroNights16: Enterprise Vulnerability Management“).
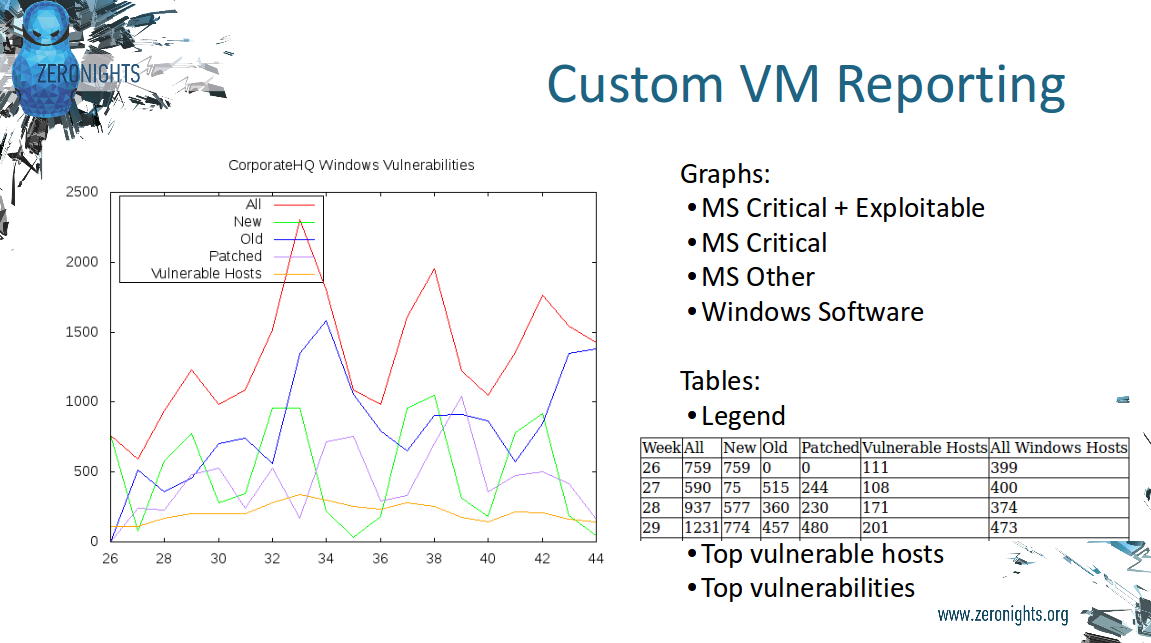
It seems like Kenna doesn’t support them yet.
Upd. Actually they do. I just haven’t found where. My fault =(
Ed Bellis from Kenna added comment about the historical time-series chart. At Dashboards tab you can press on Reporting button and see pretty good dynamical reports for Asset Group.
I took this screenshot from official whitepaper “Reporting on Risk to the Board“:
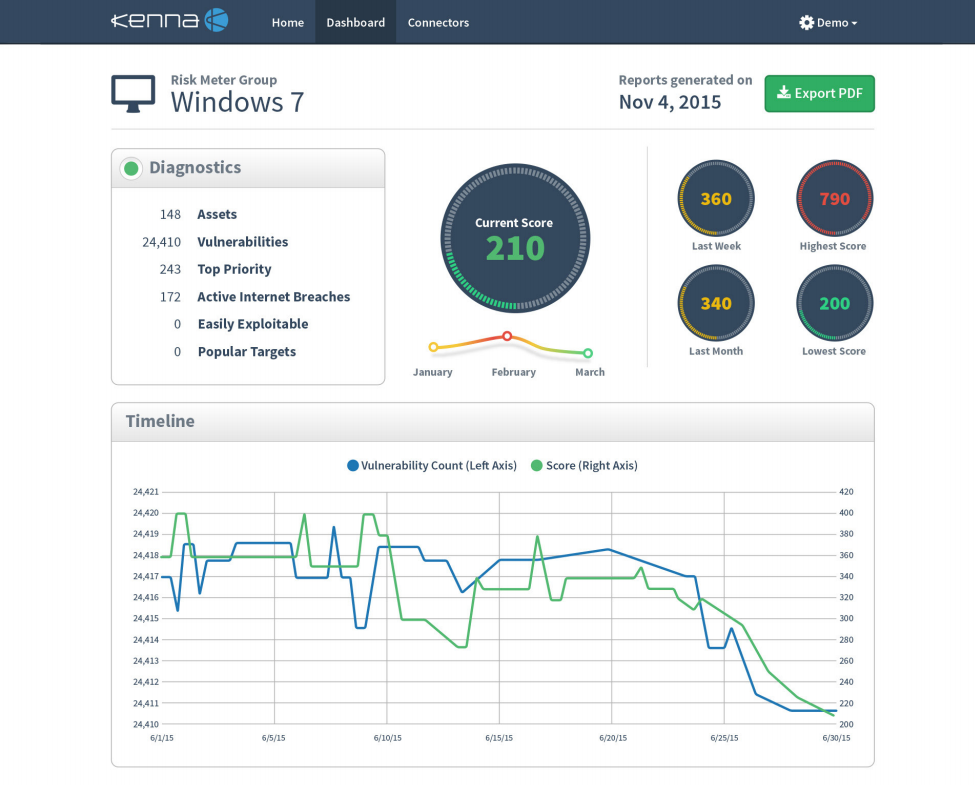
…Series charts: Risk Score Over Time, Open Vulnerabilities and Active Assets Over Time, Mean Time to Remediate, Historical Timeline on Top Priority – Active Internet Breaches – Easily Exploitable – Malware Exploitable – and Popular Targets, Open Vulnerabilities Broken Down by Risk over time, Active Assets Broken Down By Risk over time, and Vulnerabilities by Status over time
In real life it also seems great! So, I think it’s an advantage.
– Plugin to CVE id conversion
This one is huge! I don’t like the idea to go from the scanner plugins to CVE. 🙁
I understand why they do this – it’s a very natural way to combine scan results from different scanners: Nessus, Qualys, Nexpose, etc.. But it also adds ridiculous false positives in vulnerability detection and fix suggestions, it may also lead to the losses of critical vulnerability data.
For example, if Nessus detects on some Linux server “Transport Layer Security (TLS) Protocol CRIME Vulnerability“, Kenna will make a decision that this server is vulnerable to CVE-2012-4930:
The SPDY protocol 3 and earlier, as used in Mozilla Firefox, Google Chrome, and other products, can perform TLS encryption of compressed data without properly obfuscating the length of the unencrypted data, which allows man-in-the-middle attackers to obtain plaintext HTTP headers by observing length differences during a series of guesses in which a string in an HTTP request potentially matches an unknown string in an HTTP header, aka a “CRIME” attack.
And will recommend to update web-browser on the server. 🙂 Because Nessus plugin has a link to this CVE. Pretty funny, isn’t it.
And what will be in a case of some common Nessus plugin “Web Server Directory Traversal Arbitrary File Access“. Look, it has 22 CVE links to the problems in various software, like HP StorageWorks, HServer, Node.js, QuickShare… Do you really want to see all of this in a vulnerability list for your Asset? 🙂
It’s a problem of the CVE data itself: description, classification (see “CWEs in NVD CVE feed: analysis and complaints“), delays (see “Forever “reserved” CVEs“). It’s also a problem of mapping Plugin -> CVE id in scanner. It’s simply not good enough to use it like Kenna does. And what about vulnerabilities without CVEs? There are plenty of them, for example for Apple products.
I don’t know how the Kenna will solve this problem. Maybe they could filter somehow this unrelated CVE ids, maybe they will operate with different vulnerability structures, mapping them on scanner detection plugins directly. In own my scripts I prefer the second option.
Upd. Ed Bellis from Kenna added comment about the fixes:
- You can flag the fix as incorrect and the product will learn from this.
- Kenna can enable a feature flag “use scanner fixes” which will pull the solutions from the scanner. <- Imho, this should be the most accurate way.
Vulnerabilities also can be marked as false positives:
On the other hand, there simply should not be such vulnerabilities.
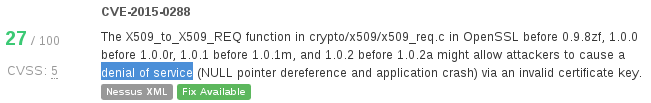
– No vulnerability types
There are no vulnerability types: RCE, DoS, XSS, etc. It’s not clear how the attacker will be exploiting detected vulnerabilities. Simply because there is no such information for CVEs available and you need to get it somehow from the text description. it’s not an easy task.
upd. Ed Bellis from Kenna added in comments that they support this. For example, it’s possible to filter RCE:
![]()
And it seems like they search for “execute arbitrary code” in description of the vulnerability.
It’s also possible to get great cvss report if you press on HUD button: ![]()
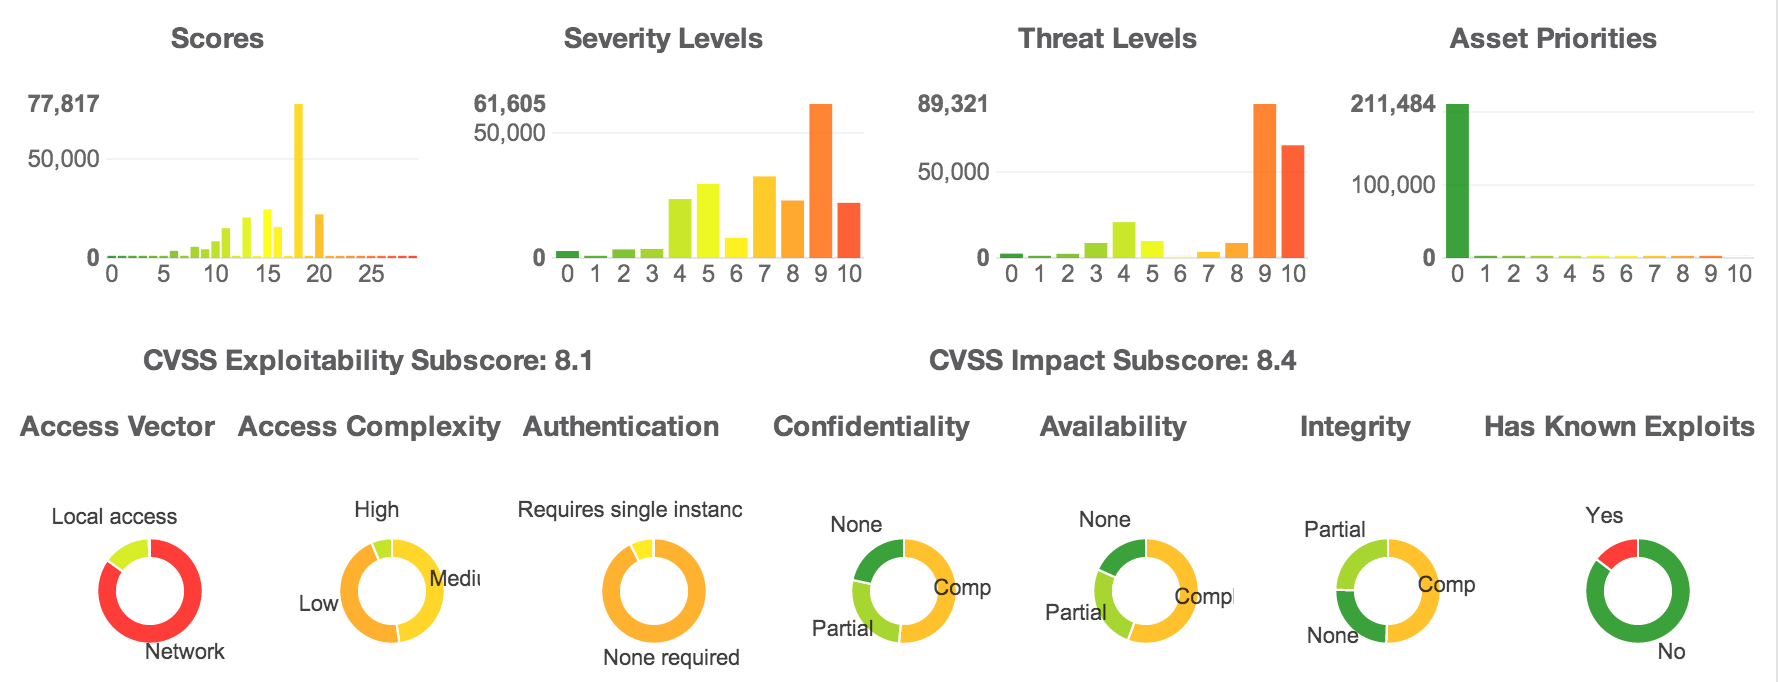
It’s a screenshot from old version of Kenna. Now they added “Has Known Malware” widget and removed Asset Priorities widget.
However I will keep this one in cons, because not all vulnerabilities have types, even when the types are clearly readable in description:
It would be great if solutions like Kenna could model the actions of potential attacker, describe the consequences of such attack in business terms. It certainly requires a deeper understanding which vulnerabilities are practically exploitable and which are not, and maybe even the abilities to demonstrate the attack in a real environment.

Hi! My name is Alexander and I am a Vulnerability Management specialist. You can read more about me here. Currently, the best way to follow me is my Telegram channel @avleonovcom. I update it more often than this site. If you haven’t used Telegram yet, give it a try. It’s great. You can discuss my posts or ask questions at @avleonovchat.
А всех русскоязычных я приглашаю в ещё один телеграмм канал @avleonovrus, первым делом теперь пишу туда.
Hi Alexander, great write-up. I wanted to follow up on a couple of items here…
As you mentioned, Fixes will take a look at the CVE and the assets operating system to make a best guess on the fix and it’s not always correct. Kenna does supply a list of alternate fixes that are available for each fix but also have two other mechanisms to address this. 1. You can flag the fix as incorrect and the product will learn from this. 2. We can also enable a feature flag for you called “use scanner fixes” which will pull the solutions from the scanner if you wish.
Regarding historical time-series charts and no time scale, when you create an asset Risk Meter group we begin collecting several metrics on that group including many historical metrics. You can find these under the Reporting button and include the following historical time series charts: Risk Score Over Time, Open Vulnerabilities and Active Assets Over Time, Mean Time to Remediate, Historical Timeline on Top Priority – Active Internet Breaches – Easily Exploitable – Malware Exploitable – and Popular Targets, Open Vulnerabilities Broken Down by Risk over time, Active Assets Broken Down By Risk over time, and Vulnerabilities by Status over time. We are always looking to add additional metrics to our reporting capabilities and these tend to be customer-driven.
Finally, regarding vulnerability types, we do have some (albeit not all) filters for pivoting on vulnerability types. As you mentioned in your post, there are a lot of filters in the sidebar of the Home screen. Some of these include vulnerability filters on RCEs, as well as WASC classes like XSS, SQL injection, etc. Additionally, if you open up the “HUD” in the Home screen you can filter on the CVSS sub-metrics by clicking on the graphs including: confidentiality, integrity, availability, and access vectors.
Overall this is a great write-up and I’m looking forward to seeing the API post as well. Don’t hesitate to let me know if you run into any questions or need anything.
Hi Ed!
Thank you very much for your comment and your kind words! I checked your clarifications and updated the post. I think it became much more objective. Thanks again!
Pingback: Kenna Security: Connectors and REST API | Alexander V. Leonov
Pingback: Masking Vulnerability Scan reports | Alexander V. Leonov
Pingback: My short review of “The Forrester Wave: Vulnerability Risk Management, Q1 2018” | Alexander V. Leonov
Pingback: What’s wrong with patch-based Vulnerability Management checks? | Alexander V. Leonov