
In this first post I want to write about Splunk and Nessus integration via official “Splunk Add-on for Tenable”: how to install this application, its pros and cons.
You can download Splunk application package for Tenable Nessus and SecurityCenter from official website here (free registration is required). All documentation is available here.
Installation and configuration
You can install this file in App menu of your Splunk server at http://your_splunk_server:8000/en-US/manager/launcher/apps/local
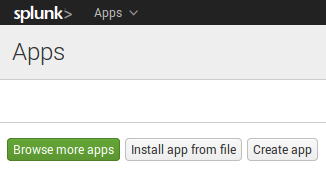
Then find “Splunk Add-on for Tenable” on Splunk starting screen and click on it to continue configuration process.

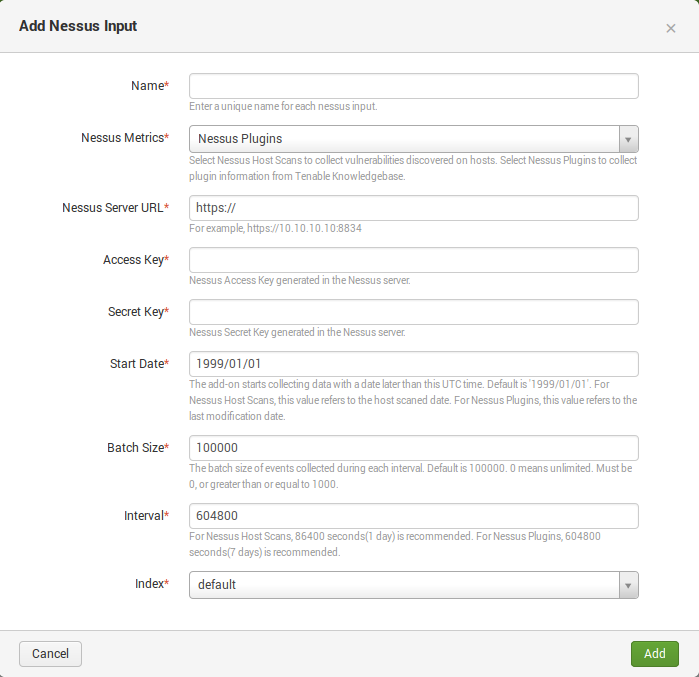
To configure application, you need to set up Nessus Inputs. Fill up following parameters: address of your Nessus server, keys for authentication, data type that will be exported (Nessus Metrics: Nessus Plugins or Nessus Host Scans), interval for synchronization, start date, batch size, and Splunk index where data will be stored.
Warning! Please don’t use spaces (” “) in Input name! This recommendation may sound silly, but Input is actually a text configuration inside Splunk and spaces in Input names may break it. The export process simply won’t start. And it will be hard to troubleshoot.
It’s better keep Nessus data, as well as any Splunk application data, in a separate index. You can manage them (create/delete) at http://your_splunk_server:8000/en-US/manager/launcher/data/indexes.
With “Nessus Plugins” metric you may export Nessus Knowledge base in Splunk. Why KB analysis may be useful read in “Vulnerability scanners: a view from the vendor and end user side” and “Use multiple vulnerability scanners in the name of good“.
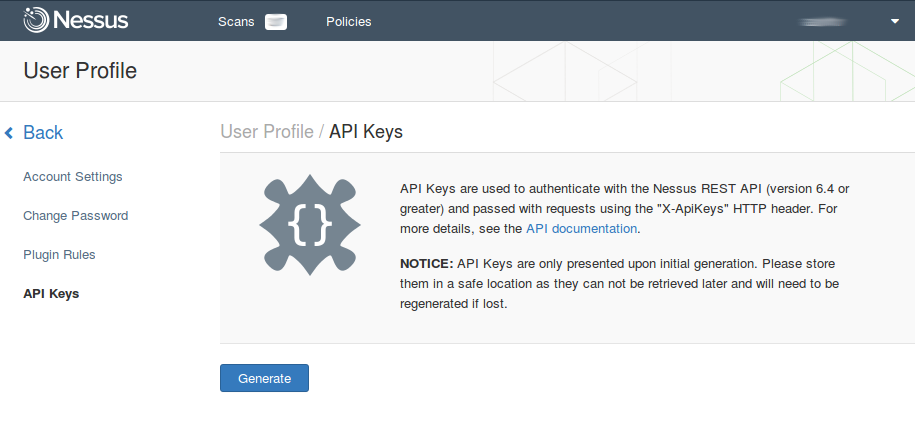
Nessus Access and Secret keys may be configured in Nessus user Profile at https://your_nessus_server:8834/#/user-profile/api-keys
Nessus users can’t see scans of each other, that’s why you should add separate Splunk Inputs for every user whose scans you want to export.
Enable saved searches at http://your_splunk_server:8000/en-US/manager/launcher/saved/searches?ns=Splunk_TA_nessus&pwnr=-&search=&app_only=1
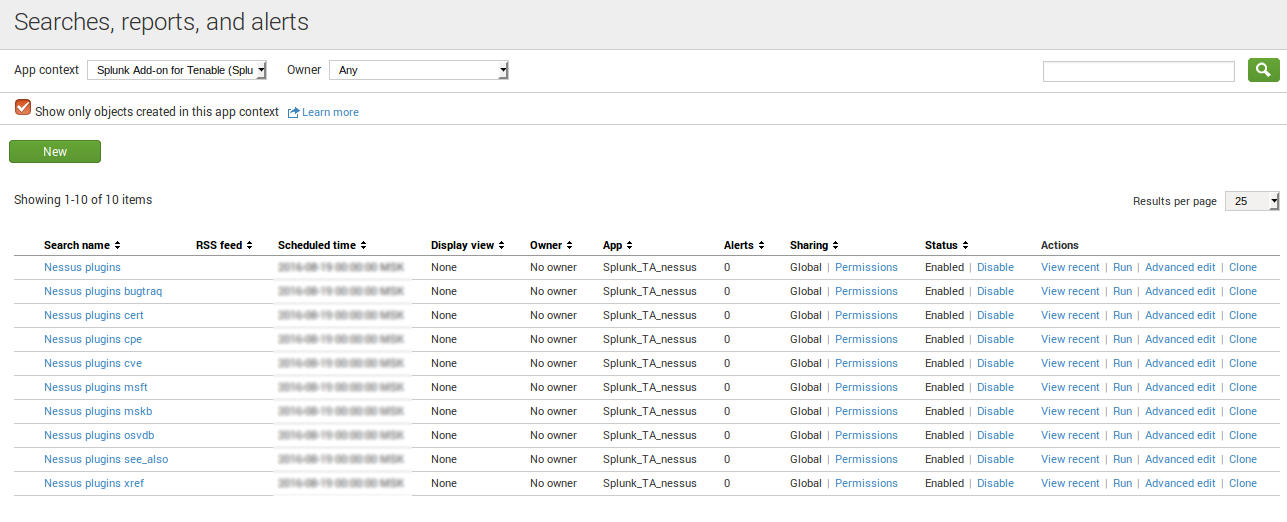
This saved searches for Nessus plugins are available:
- Nessus plugins
- Nessus plugins bugtraq
- Nessus plugins cert
- Nessus plugins cpe
- Nessus plugins cve
- Nessus plugins msft
- Nessus plugins mskb
- Nessus plugins osvdb
- Nessus plugins see_also
- Nessus plugins xref
Events
If you have done it right, Nessus data will flow automatically to your index. What kind of data is it?
Plugins from Nessus Knowledge Base
index="your_nessus_index" sourcetype="nessus:plugin" cve="cve-2014-0160"
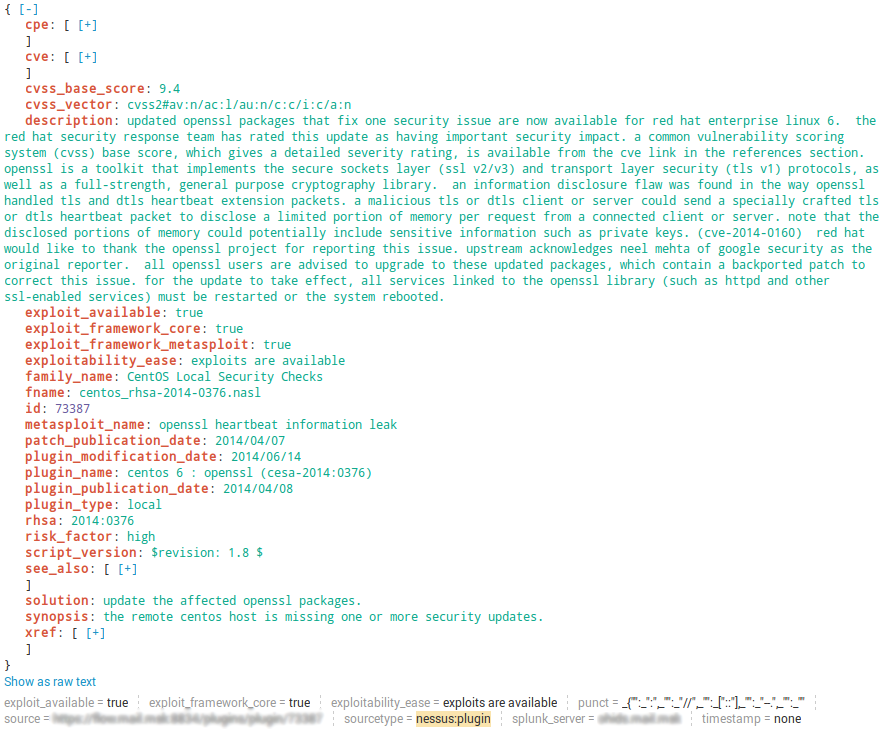
“Plugin events” are presented in a very nice form and contain full description from nasl scripts.
Nessus scan results
index="your_nessus_index" sourcetype="nessus:scan"
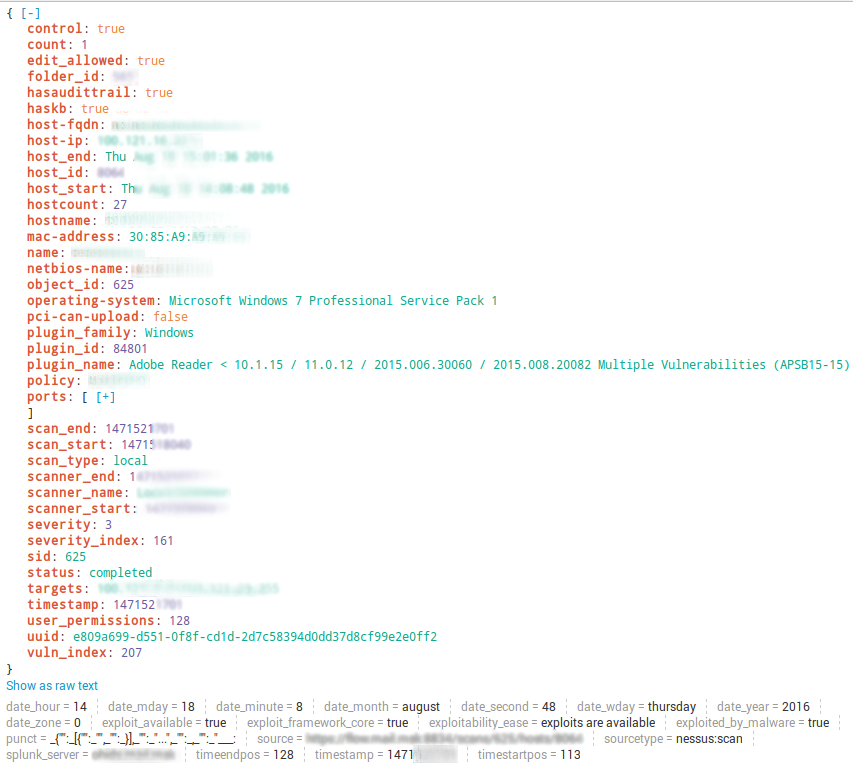
As you can see, there is no so much information about vulnerabilities: no description, plugin output or cvss_vector. It may be very hard to make vulnerability prioritization using only with data from “nessus:scan”. Perhaps it is possible to use it together with “nessus:plugin”. For me it would be much easier if “nessus:scan” store full information about the vulnerability as it is in Nessus report file.
Dashboards
If you want to use standard “Splunk Add-on for Tenable” dashboards without modifications of queries, add index you use for storing Nessus data to “Settings -> Users and authentication -> Access controls -> Roles -> your_role -> Indexes searched by default”. So, you won’t need to specify index=”your_nessus_index” in Nessus search requests.
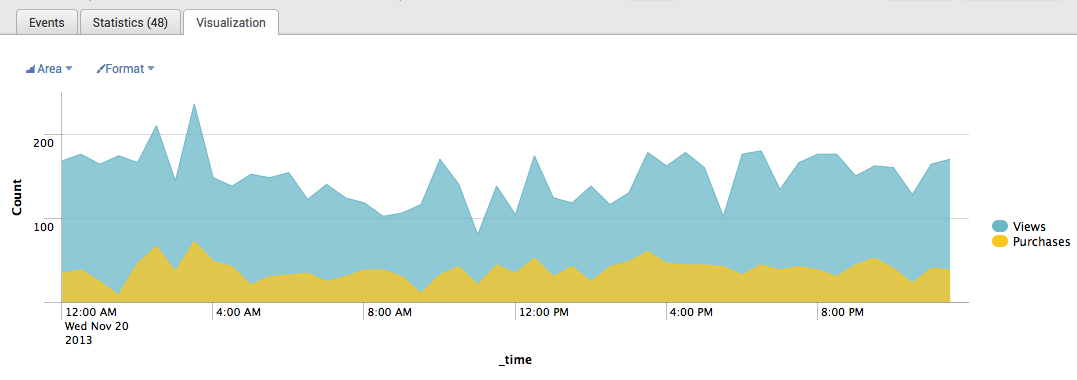
Warning! I don’t want to show actual data here. I will try to describe how it looks like on standard examples of Splunk charts.
Available prebuilt panels:
Nessus Graph – Severity Count over Time. It’s a time chart with critical, high, medium, low and informational events. If you press on a graph, you vulnerabilities with this criticality detected by scan started at this day. For example, (sourcetype=”nessus” OR sourcetype=”nessus:scan”) severity=* severity=informational ; Date range between 08/16/2016 and 08/16/2016
Is it informative? Don’t think so, it just shows, that we scanned something, got some results. Some of results are critical, some not. The thing is it’s not about security level of the infrastructure. “Informational” part will be always much bigger than, than, for example critical one, so it will be even hard to see the most interesting part on the graph.
Splunk timechart example:
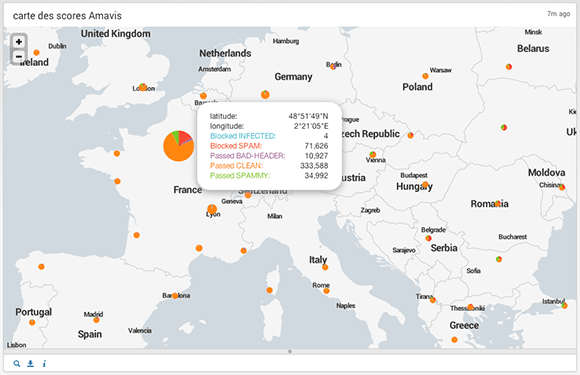
Nessus Map – Destination IP by Severity. Here Splunk tries to visualize criticality (critical, high, medium, low and informational) and amount of vulnerabilities on a world map with coordinates detected by ip-address. It may be useful if all host you scanned has static external ip-address. If not, how is it possible to visualize it on map automatically?
Splunk map example:
Nessus Pie Chart – Severity. It’s like a criticality pie diagram you have seen on a Nessus map, but for ALL hosts and ALL periods of time. Like the sum of average temperatures in a hospital.
Nessus Table – Hosts with Elevated Severity. It’s a table Severity(critical … informational);dest (ip). It’s too huge for use and what if IP addressed will be dynamic?
Nessus Table – Signatures by Severity. It’s a table Severity(critical … informational);Signature (plugin name). This table is also huge and plugins are presented just in alphabet order without classification by plugin family.
Conclusion
In my opinion, the advantages of this application is that it is supported officially by Splunk, operates automatically on the Splunk server and stores the data in a fairly adequate form (especially the “nessus:plugin”).
On the other hand, the standard dashboards are nearly useless. “nessus:scan” is not well-suitable for vulnerability prioritization. This justifies the use of alternative methods for Nessus scan result export to Splunk. Especially if there is also a need to filter or modify scan data before export, and manage export process flexibly.

Hi! My name is Alexander and I am a Vulnerability Management specialist. You can read more about me here. Currently, the best way to follow me is my Telegram channel @avleonovcom. I update it more often than this site. If you haven’t used Telegram yet, give it a try. It’s great. You can discuss my posts or ask questions at @avleonovchat.
А всех русскоязычных я приглашаю в ещё один телеграмм канал @avleonovrus, первым делом теперь пишу туда.
Pingback: Export anything in Splunk with HTTP Event Collector | Alexander V. Leonov
Pingback: Seccubus installation and GUI overview | Alexander V. Leonov
Does it work with nessus 8.0.?
Yes, if you have scan results in Nessus2 XML format they can be exported to Splunk
we have 8.6,
can you share how to export this to SIEM, either splunk or ELK?
Pingback: How to list, create, update and delete Grafana dashboards via API | Alexander V. Leonov