What’s actually new in Tenable.io VM application. My last post was about the structure of a new Tenable.io cloud platform. Now, let’s see what is actually new in Tenable.io Vulnerability Management application.
Tenable.io VM is obviously based on Nessus Cloud, which in its turn had features similar to Nessus Manager briefly reviewed earlier. So, today I want to concentrate only on new features.
According to the public interface screenshots and Tenable.io datasheets, it will have some new dashboards and reports, free integration with PVS and Nessus deployed on-premise, and something very new in asset management.
Web interface of Tenable.io is located at https://cloud.tenable.com/nessus6.html
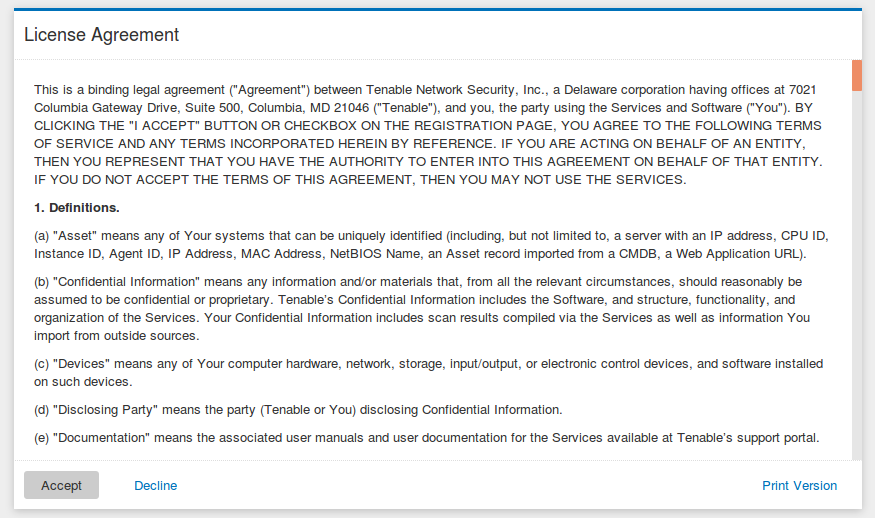
After you have set a new password you should accept a very long License Agreement. Well, I haven’t read it all, shame on me, but basically there should be and agreement to scan only your own servers.
Tutorials
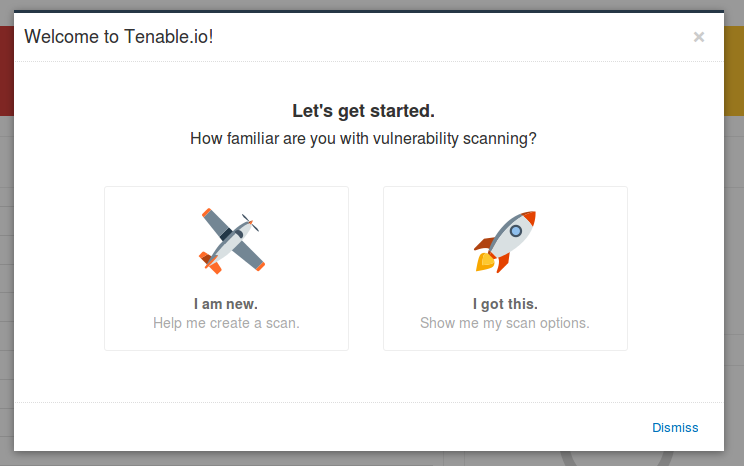
At first login Tenable.io provide a small tutorial for newbies:
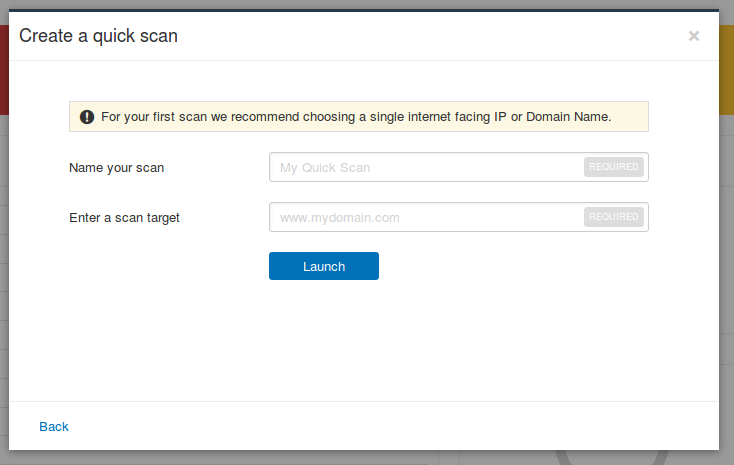
A very short tutorial. Like “give me a target, choose a name of the scan and I will launch a scan task for you”. Cute 🙂
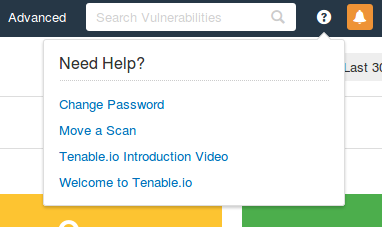
Tenable also released interactive tips. It’s under question mark icon. Pretty cool feature.
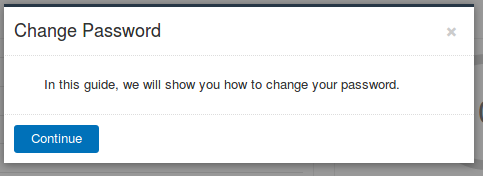
For example, you want to figure out how to change password in Tenable.io, and clicked on “Change Password”.
It will guide you through the whole process:
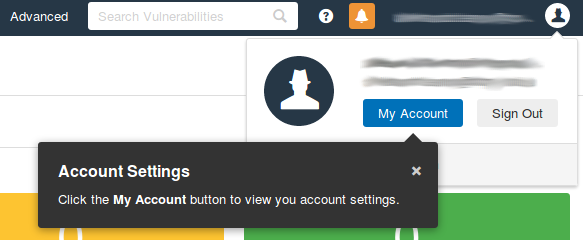
Step by step, click by click:
End so on. It is one of the best interactive tutorials I ever seen.
Dashboards
“Dashboards” is the main screen of Tenable.io VM.
To say truth, I don’t regularly use this kind of dashboards and reports. However, sometimes they can be very inspiring. You can make some tasks manually, see the results in dashboards, understand that it is useful and then figure out how to get the same data automatically via API and report processing and how to automate the response. Dashboards is definitely a good thing, even if you use them only as an example of product capabilities.
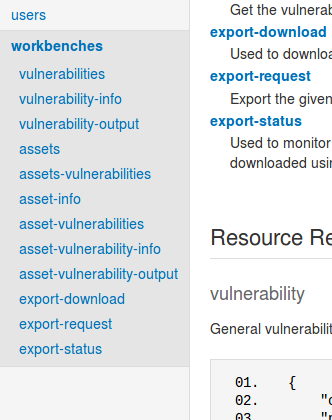
If you want to get data from dashboards tom make some automation you can use workbenches API requests (see it in Tenable.io API Documentation)
So, let’s have a close look on Tenable.io VM dashboards.
Vulnerabilities
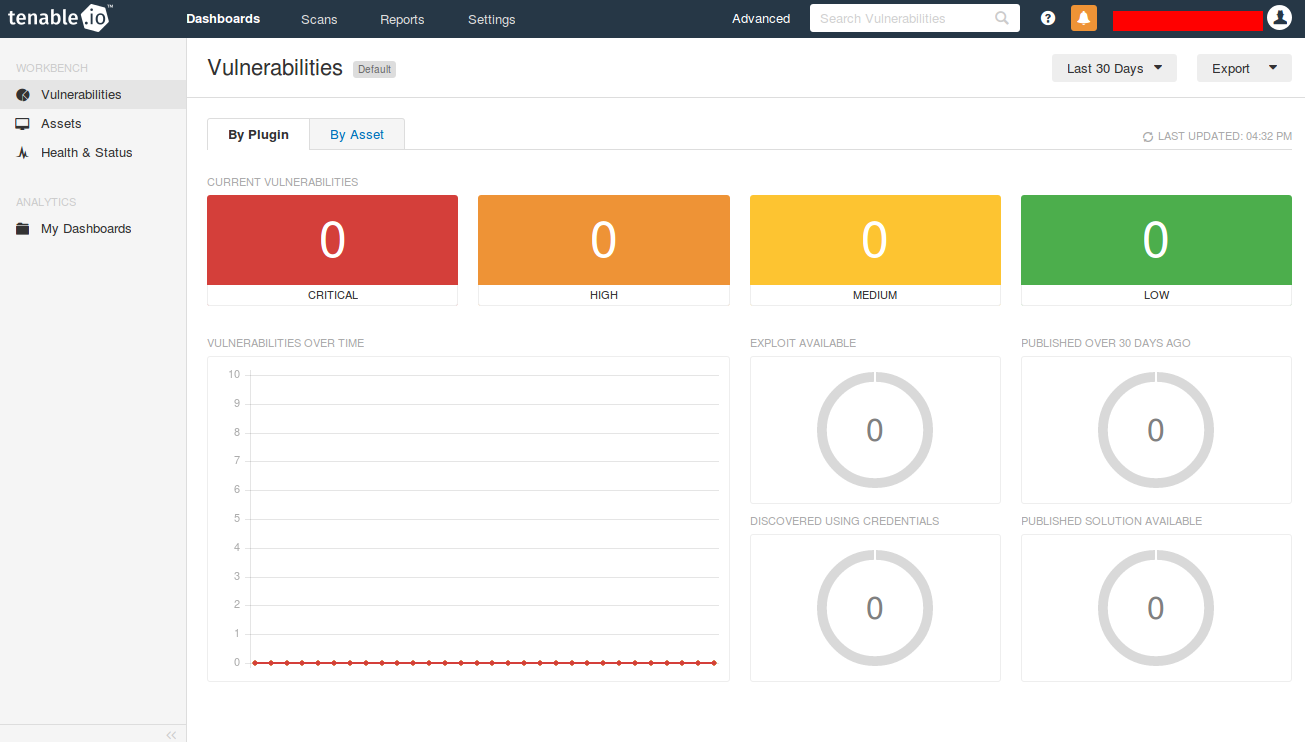
Clean “Dashboards -> Vulnerabilities” screen before any scan performed looks like this:
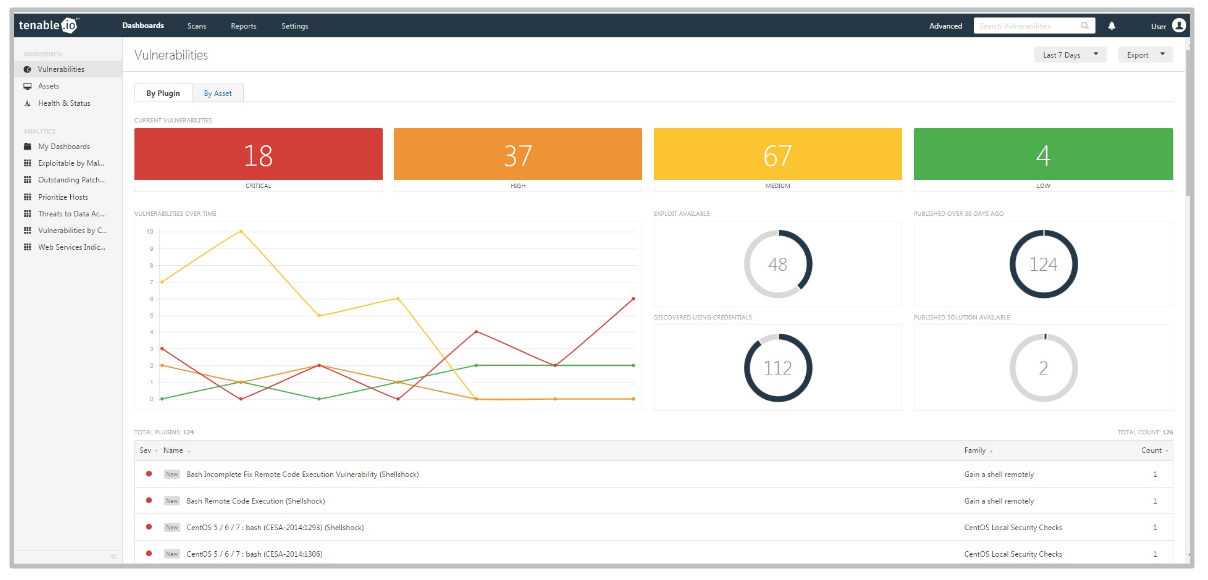
When there will be some scan data it will look like this (from Tenable.io datasheet):
Diagrams and counters showing vulnerabilities by plugin:
- Current Vulnerabilities (Critical, High, Medium, Low)
- “Vulnerabilities over time” graph
- Exploit Available
- Published Over 30 Days Ago
- Discovered Using Credentials
- Published Solution Available
Everything is clickable, so you can get a list of vulnerabilities for every category.
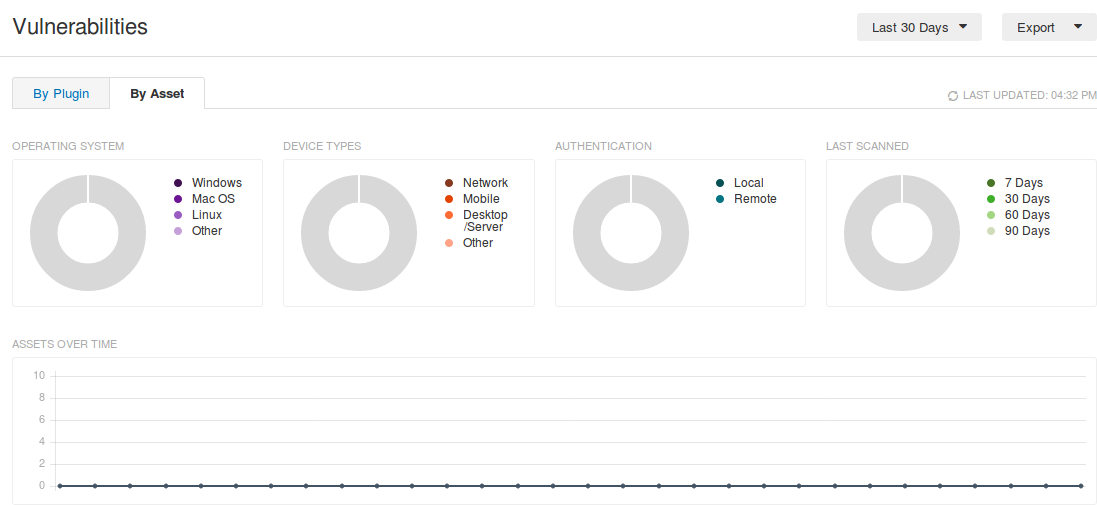
Here is “Vulnerabilities By Asset” dashboard:
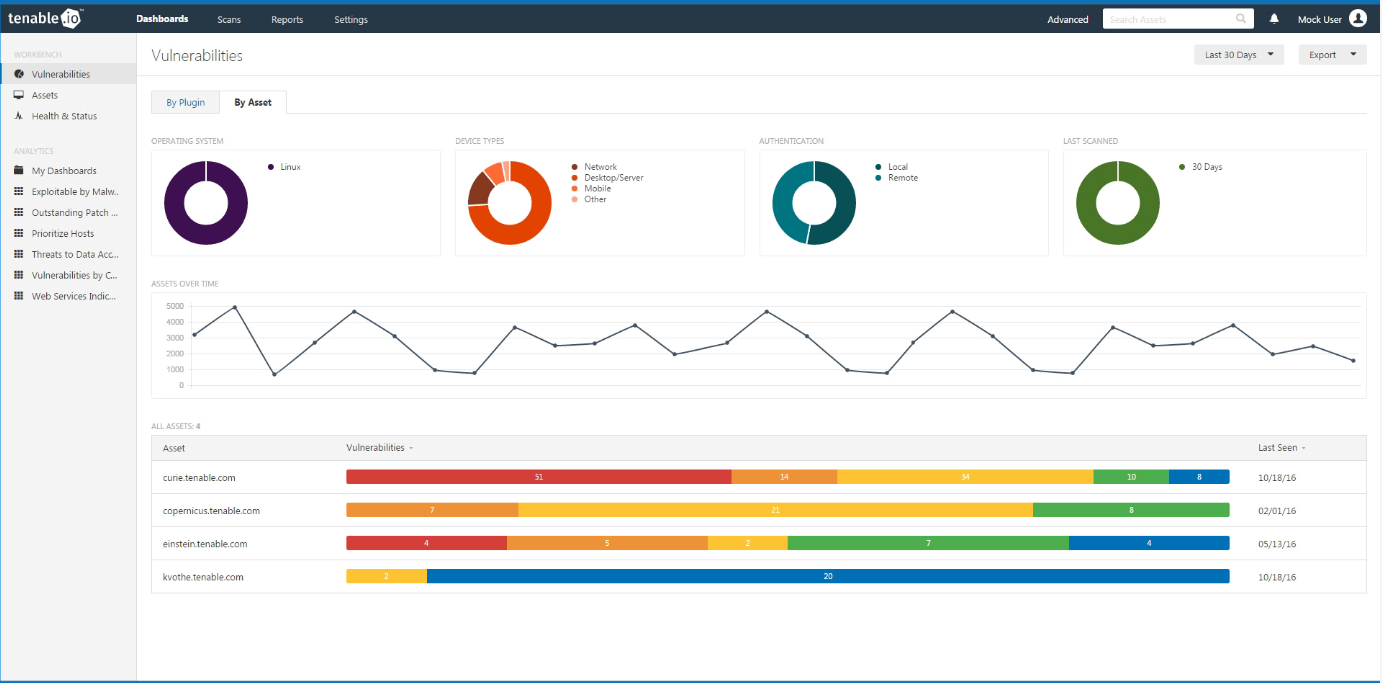
When you add some scan data it will look like this (from Tenable.io Introduction Video):
Diagrams and graphs on this dashboard:
- Operating system (Windows, Mac OS, Linux, Other)
- Device type (Network, Mobile, Desktop/Server, Other)
- Authentication (Local, Remote)
- Last Scanned (7 … 90 days)
- “Assets over time” graph
In general, it shows how many systems we have some in the infrastructure and how this number changes over time. Pretty interesting information.
Assets
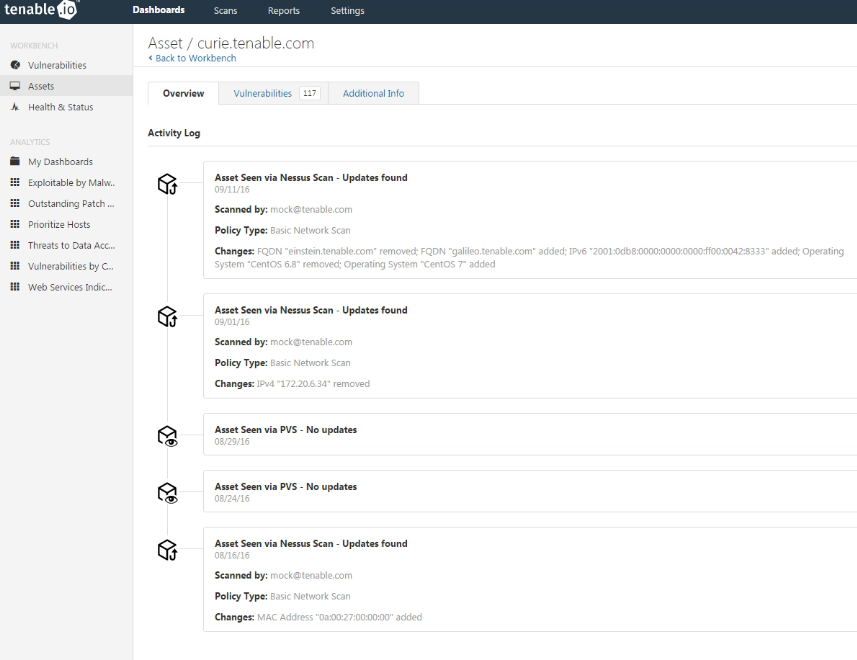
If we go down in the right-hand menu, there will be a link to “Assets” dashboard. There will be quite empty until we scan something. Tenable.io introductory video shows us how it should look like when there will be some data. For example, this dashboard can show us scan history of some asset (Activity log):
Actually this transition from an IP-address to the Asset is very important. In fact, it makes possible to build adequate reports and dashboards. IP addresses don’t accurately reflect dynamic assets (virtual machines, cloud instances, etc). Even if we use IP-address as a host identifier and it will be changing periodically the results won’t be reliable.
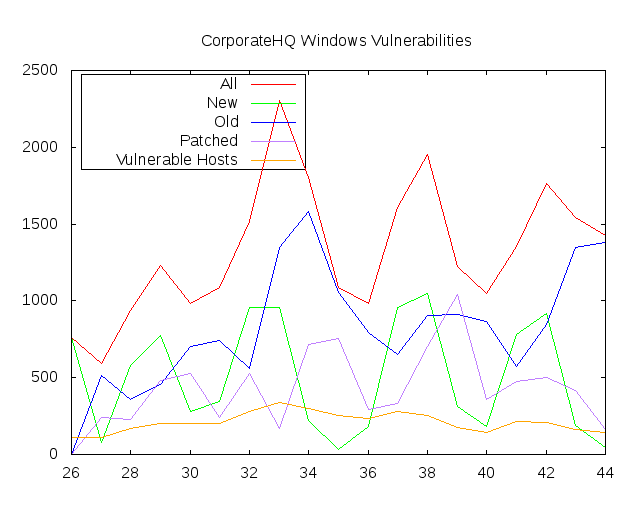
How to deal with it? We need different id. For example, when I make my custom Windows VM reports from Nessus scan data I use special id associated with the device during the OS installation. This makes possible to make this kind of graphs (synthetic data):
Basically, Tenable make very things with Tenable.io asset model. They mostly rely on Nessus Agent IDs, and IDs that scanner writes on the host during authenticated scanning in Windows registry and Linux /etc/ directory. But they can also use other markers, like hostnames, fqdn, mac addresses, etc.
This makes it possible to use new vulnerabilities statuses: new, active, fixed and reappeared. Just as we do (see. graph above).
So, Tenable is moving in a very right direction. Qualys also uses approximately the same features to track the assets.
Of course in the real world you need a lot of flexibility to track changes in the infrastructure using VM scans. For example, OS reinstallation on a laptop. If we see in scan results, that some new host have the same mac-addresses as old one, and we haven’t seen an old one for a wile, it might be a good idea to mark all vulnerabilities of the old host as “fixed”. And it is the one of many cases. Will Tenable.io be flexible enough to support this type of logic? Well, it would be good.
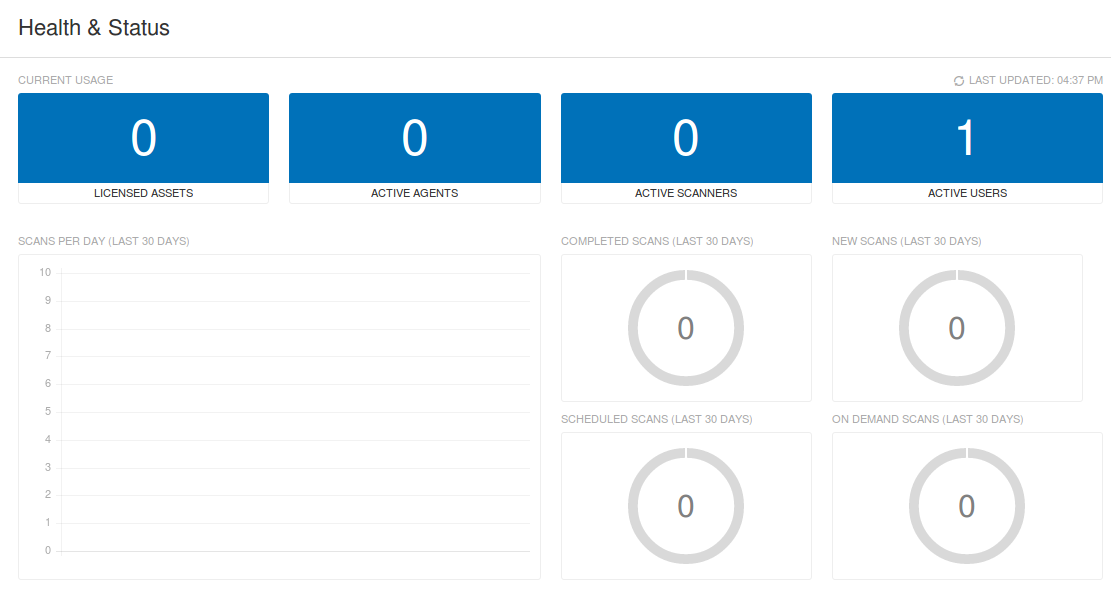
Health and Status
Now this empty dashboard shows only one Active user now – me.
But it can also show pretty interesting information about scanner usage:
- Licensed Assets
- Active Agents
- Active Scanners
- Active Users
And for last month:
- Scans per day graph
- Completed scans
- New Scans
- Scheduled scans
- On demand scans
You can evaluate how effectively you use the scanner and make sure everything is working properly. Unfortunately, this GUI elements are not clickable.
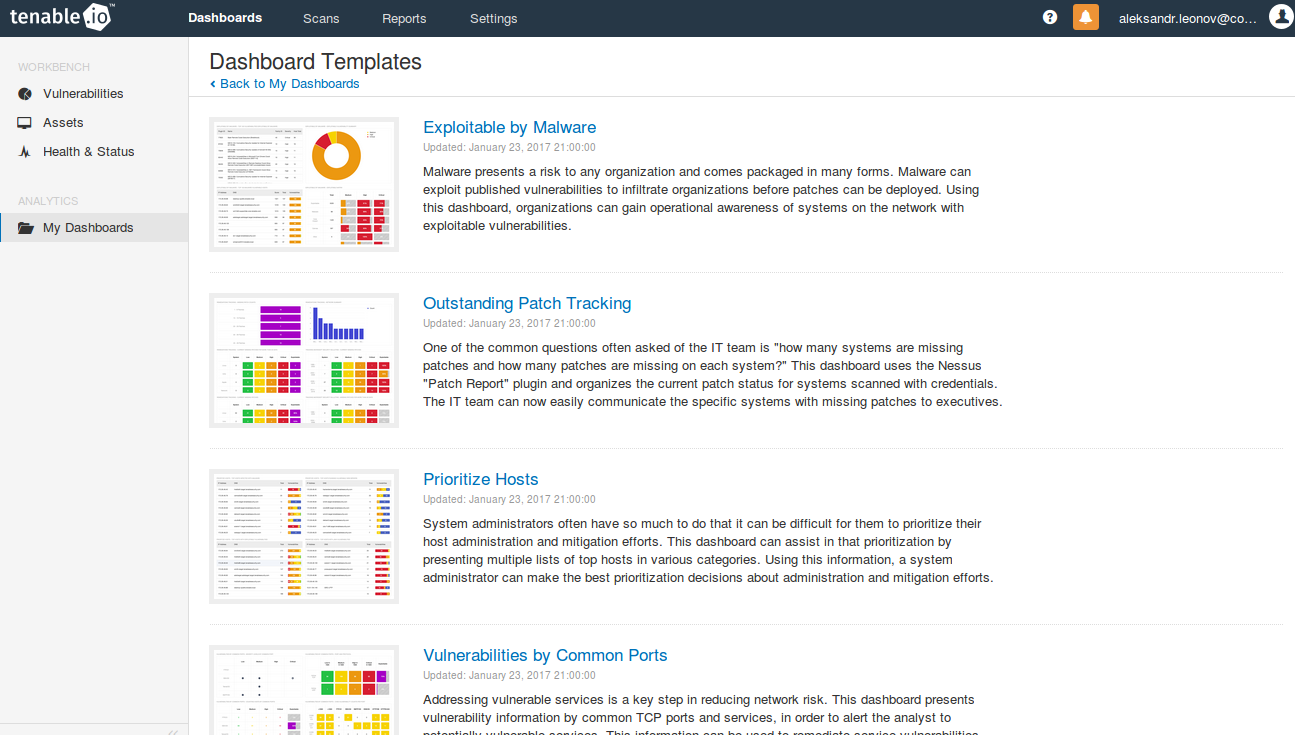
Other Dashboards
Additional dashboards can gives a good idea what else you can try do with Nessus.
Available dashboards:
- Exploitable by Malware
- Outstanding Patch Tracking
- Prioritize Hosts
- Vulnerabilities by Common Ports
- Vulnerability Management
- Web Services Indicator
Scans
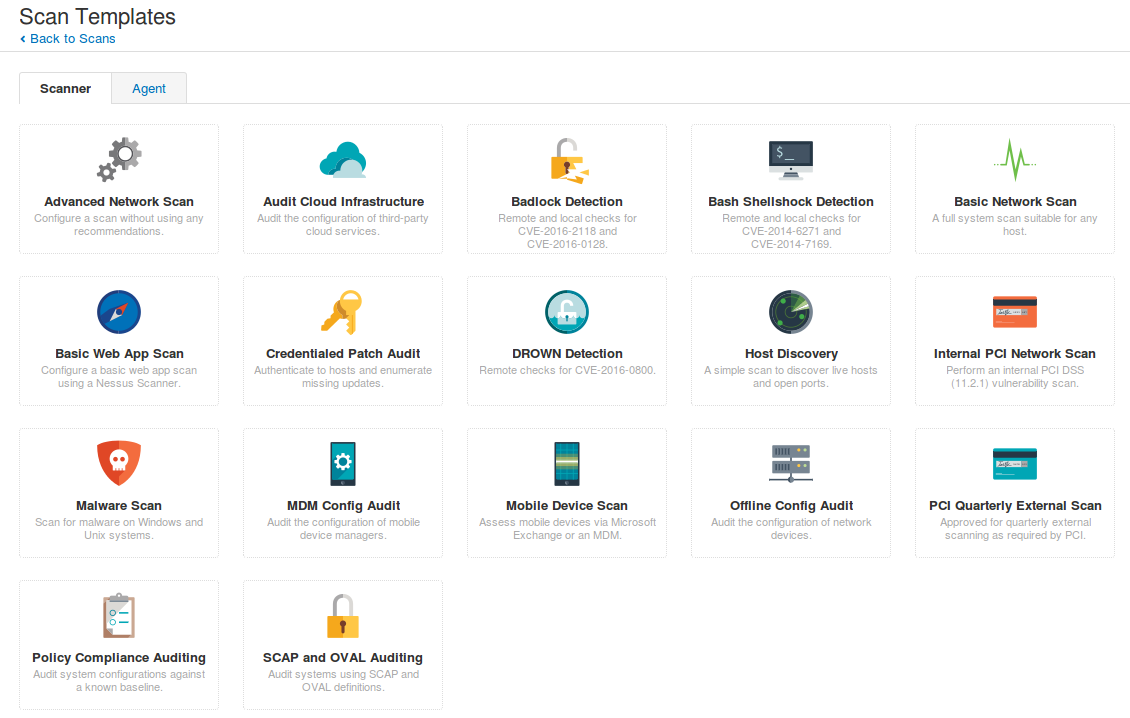
Main active scanner scanning functionality of Nessus.io VM (nasl plugins, port scanner and .audit scripts) is the same as in Nessus Manager, Nessus Professional and Nessus for SecurityCenter. And this is the really great thing, because it makes comparison of the tools much easier.
Scan templates now have new beautiful icons:
Target groups and Exclusions
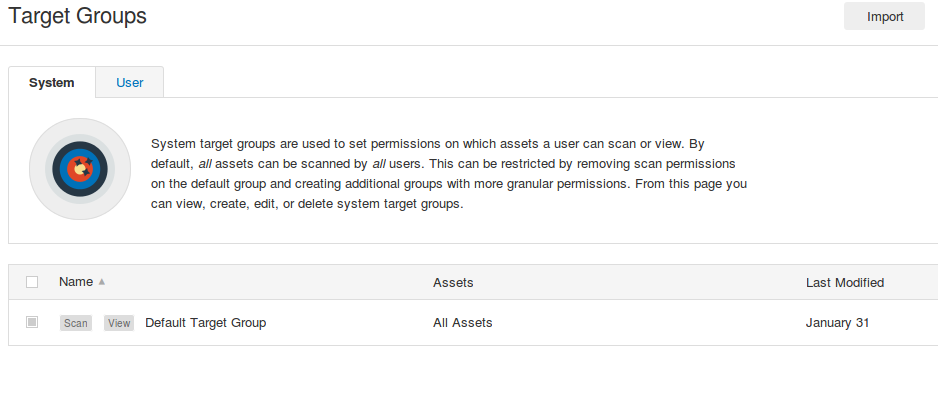
In Tenable.io you can set what users will have permissions to scan different groups of hosts in “Target Groups”:
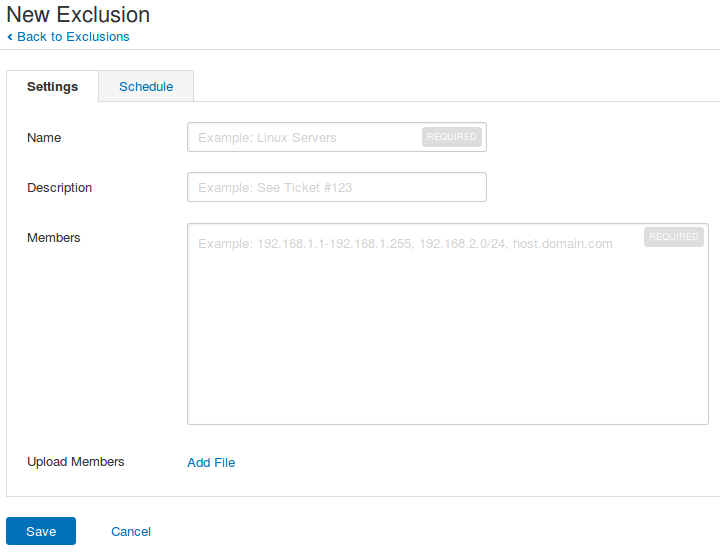
You can also prevent scanning of some hosts at all or for some period of time:
In “Exclusions” you can specify the hosts…
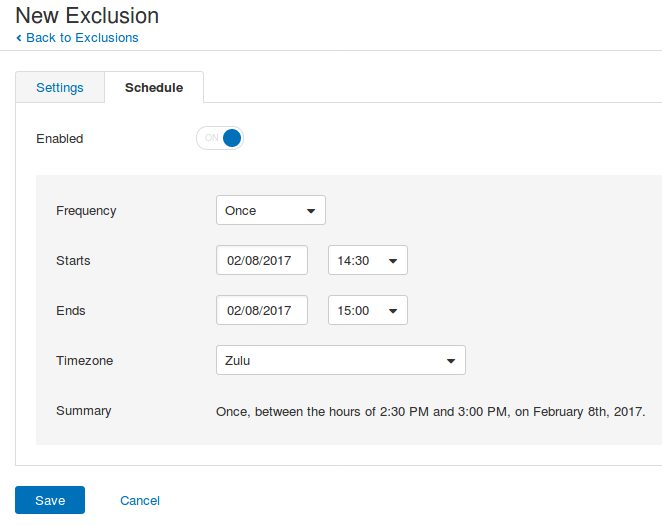
… and the time when the scanning should be prohibited:
Agents and Scanners
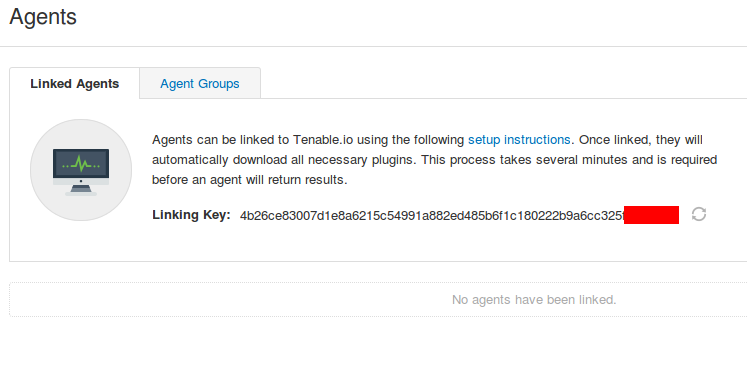
You can manage Nessus Agents in Tenable.io the same way you do it Nessus Manager.
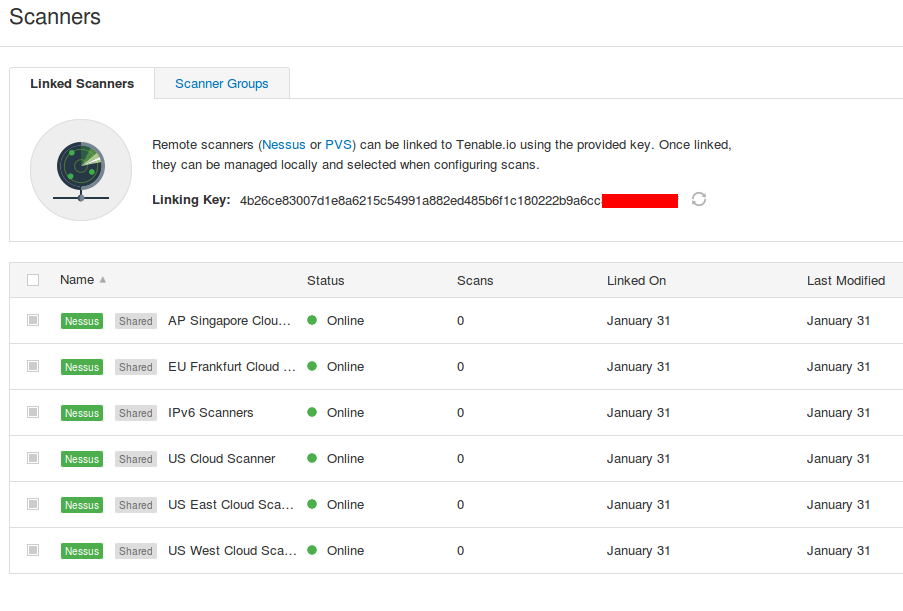
For active scanning you can use remote Nessus scanners located in United States, Singapore and Germany:
You can also deploy Nessus scanners and Passive Vulnerability Scanners (PVS) in your own infrastructure. You just need to download the packages (no registration required) and enter the Linking Key during the installation.
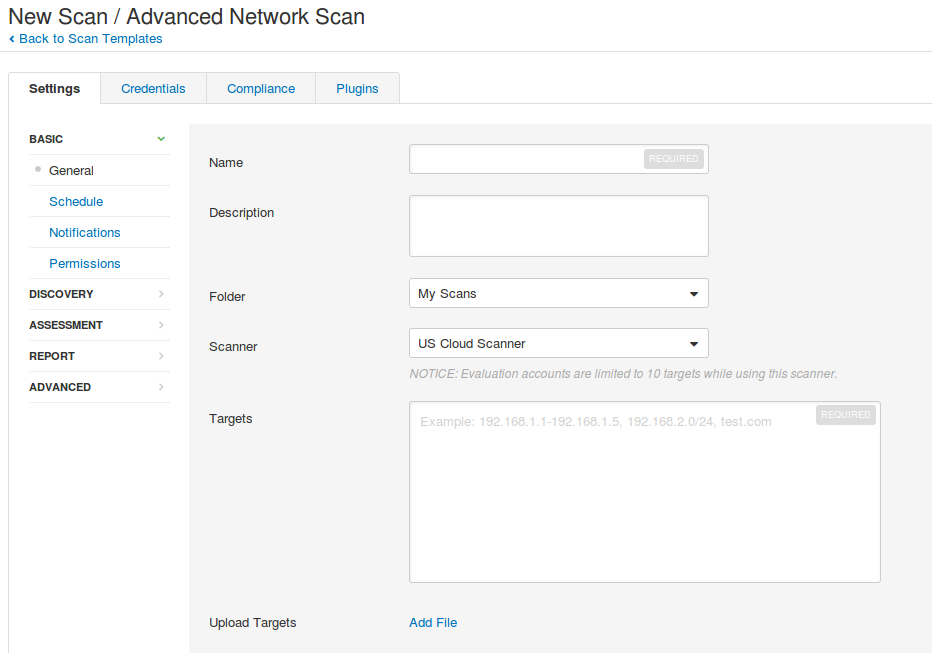
Note that remote scanners in the trial version can scan only 10 hosts. For Nessus scanners deployed on premise, there is no such restriction.
Upd. February 2, “
Reports
In Tenable.io you can regularly generate advanced pdf-reports based on the scan results:
However, it’s impossible to send them automatically by email yet.
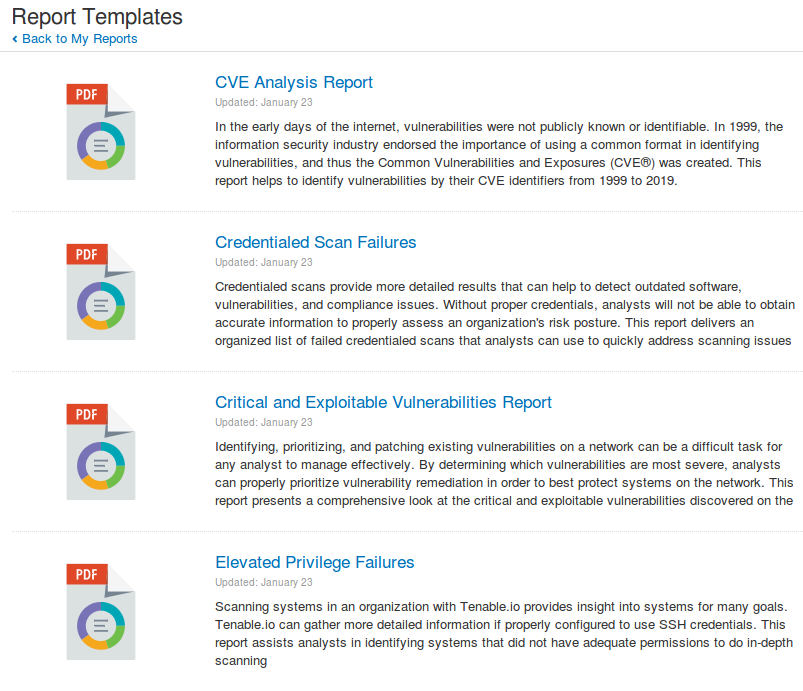
Available report templates:
- CVE Analysis Report
- Credentialed Scan Failures
- Critical and Exploitable Vulnerabilities Report
- Elevated Privilege Failures
- Exploit Frameworks
- Exploitable by Malware
- Malicious Code Prevention Report
- Outstanding Patch Tracking
- Prioritize Hosts
- Unsupported OS Report
- Vulnerabilities by Common Ports
- Vulnerability Detail Report
- Vulnerability Management
- Web Services Indicator
- Windows Unsupported and Unauthorized Software
- Wireless Configuration Report
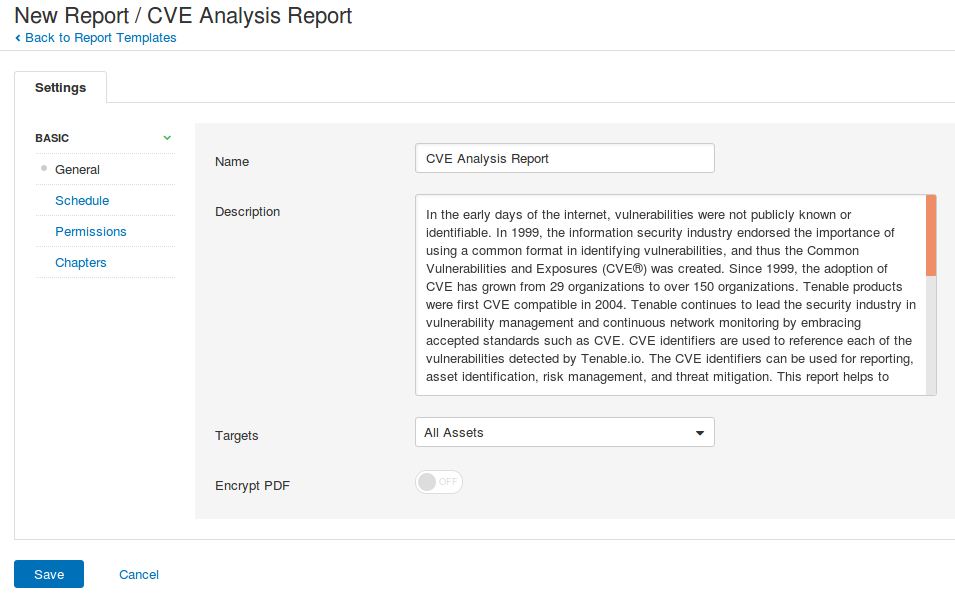
Wizard for configuring the report:
Settings
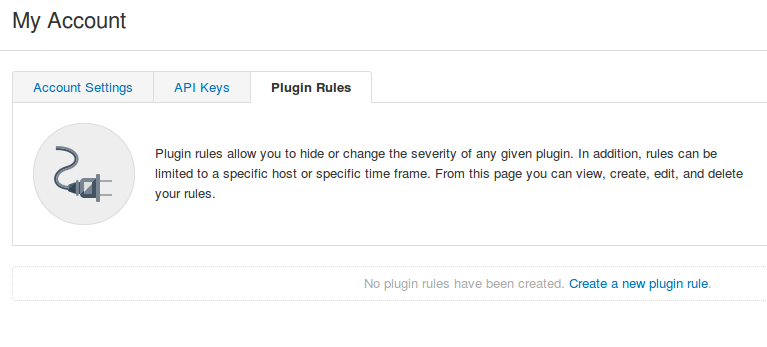
And finally this is how Settings tab looks like:
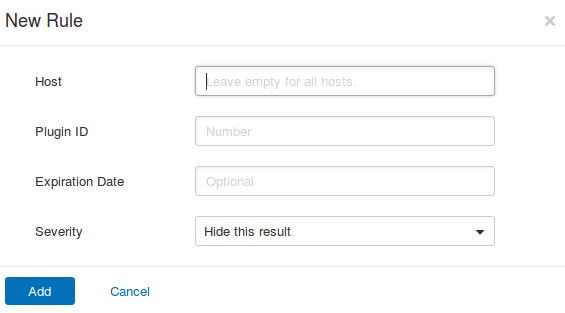
I liked this way to set up exceptions for plugins in My Account.
You can change NASL plugin severity level here for some hosts or for all hosts:
In conclusion
In my opinion new features of Tenable Vulnerability Management service are all very useful and interesting. I hope that someday it will be possible to use such a solution on premise well. It will satisfy those customers who are, as well as me, against of storing scan data and scan accounts in the cloud. But, in any case, Tenable.io will be a very good option for perimeter scanning without authentication for any customer.
On the other hand, licensing by hosts for obvious reasons, makes the solution not as attractive as Nessus Professional, which gives you an opportunity can scan almost everything that you can reach for about $2200 in a year.

Hi! My name is Alexander and I am a Vulnerability Management specialist. You can read more about me here. Currently, the best way to follow me is my Telegram channel @avleonovcom. I update it more often than this site. If you haven’t used Telegram yet, give it a try. It’s great. You can discuss my posts or ask questions at @avleonovchat.
А всех русскоязычных я приглашаю в ещё один телеграмм канал @avleonovrus, первым делом теперь пишу туда.






Hi Alexander,
i’m wondering how Nessus will bind IPs to one assets if we use only authenticated scanning? (no agents at all)
And how quantity of licenses have been managed if we use only VMs (always deploy/redeploy/termination)?
Hi Nikolay,
They will write id in win register or in file in /etc/ and then read it during the next scans.
I suppose if we have an image of VM with existing Tenable.io asset id, it will be count as the same asset each time we deploy and scan it. Of course it is not right for the most cases.
Pingback: Gartner’s view on Vulnerability Management market | Alexander V. Leonov
Pingback: Tenable.IO VM: connected scanners and asset UUIDs | Alexander V. Leonov
Pingback: Carbon Blacking your sensitive data it’s what the agents normally do | Alexander V. Leonov
Pingback: My short review of “The Forrester Wave: Vulnerability Risk Management, Q1 2018” | Alexander V. Leonov
Pingback: First look at Tenable.io Web Application Scanner (WAS) | Alexander V. Leonov