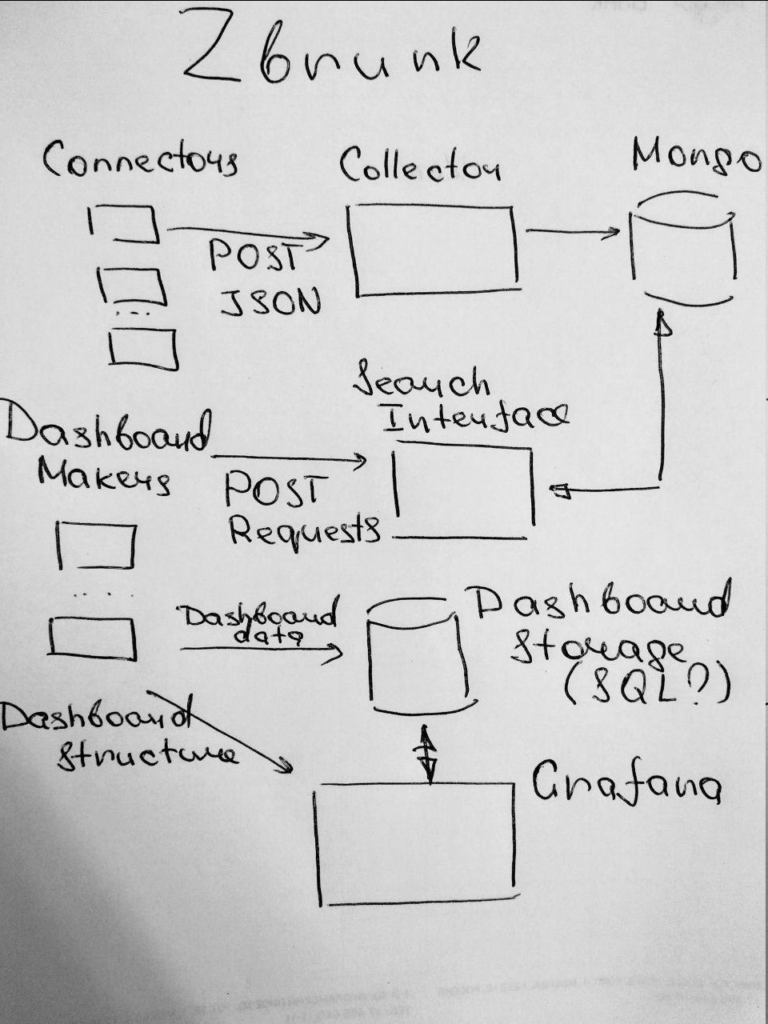
Zbrunk universal data analysis system. Zbrunk project (github) began almost like a joke. And in a way it is? In short, my friends and I decided to make an open-source (MIT license) tool, which will be a kind of alternative to Splunk for some specific tasks.

So, it will be possible to:
- Put structured JSON events in Zbrunk using http collector API
- Get the events from Zbrunk using http search API
- Make information panels based on these search requests and place them on dashboards
Why is it necessary? Well, I’ve worked a lot with Splunk in recent years. I like the main concepts, and I think working with the events is a very effective and natural way of processing and presenting data. But for my tasks (Asset Management, Compliance Management, Vulnerability Management) with several hundred megabytes of raw data per day to process and dashboards that need to be updated once or several times a day Splunk felt like an overkill. You really don’t need such performance for these tasks.
And, considering the price, it only makes sense if your organization already uses Splunk for other tasks. After Splunk decision to leave Russian market, this became even more obvious, so many people began to look for alternatives for possible and, as far as possible, painless migration.
We are realistic, the performance and search capabilities of Zbrunk will be MUCH worse. It’s impossible to make such universal and effective solution as a pet project without any resources. So, don’t expect something that will process terabytes of logs in near real time, the goal is completely different. But if you want same basic tool to make dashboards, it worth a try. ?
Now, after first weekend of coding and planning it’s possible to send events to Zbrunk just like you do it using the Splunk HTTP Event Collector and they appear in MongoDB:
$ echo -e '{"time":"1471613579", "host":"test_host", "event":{"test_key":"test_line1"}}\n{"time":"1471613580", "host":"test_host", "event":{"test_key":"test_line2"}}' > temp_data
$ curl -k https://127.0.0.1:8088/services/collector -H 'Authorization: Zbrunk 8DEE8A67-7700-4BA7-8CBF-4B917CE2352B' -d @temp_data
{"text": "Success", "code": 0}
In Mongo:
> db.events.find()
{ "_id" : ObjectId("5d62d7061600085d80bb1ea8"), "time" : "1471613579", "host" : "test_host", "event" : { "test_key" : "test_line1" }, "event_type" : "test_event" }
{ "_id" : ObjectId("5d62d7061600085d80bb1ea9"), "time" : "1471613580", "host" : "test_host", "event" : { "test_key" : "test_line2" }, "event_type" : "test_event" }
Thus, it will be very easy to use your existing custom connectors if you already have some. The next step is to make basic http search API, prepare dashboard data using these search requests and somehow show these dashboards, for example, in Grafana. Stay tuned and welcome to participate. ?


Hi! My name is Alexander and I am a Vulnerability Management specialist. You can read more about me here. Currently, the best way to follow me is my Telegram channel @avleonovcom. I update it more often than this site. If you haven’t used Telegram yet, give it a try. It’s great. You can discuss my posts or ask questions at @avleonovchat.
А всех русскоязычных я приглашаю в ещё один телеграмм канал @avleonovrus, первым делом теперь пишу туда.
