
Dealing with Nessus logs. Debugging Nessus scans is a very interesting topic. And it is not very well described even in Tenable University course. It become especially interesting when you see strange network errors in the scan results. Let’s see how we can troubleshoot Nessus scans without sending Nessus DB files to Tenable (which is, of course, the default way 😉 ).
Default logging
Let’s see default Nessus logs. I cleared log nessusd.messages file to have only logs of the latest scan:
# echo "" > /opt/nessus/var/nessus/logs/nessusd.messages
and restarted Nessus:
# /bin/systemctl start nessusd.service
I scan only one host (test-linux-host01, 192.168.56.12) with the Advanced scan profile. No default settings was set.
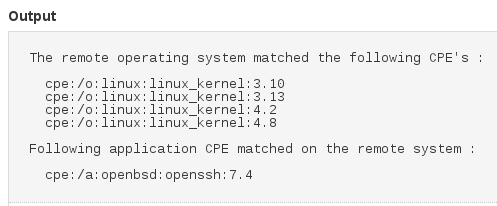
As you can see from the cpe report, it’s typical Linux host with ssh server:
What’s in the logs?
Note, that I replaced JOB_UUID b2322cb0-995a-3817-3561-61abf114b7aefcebe2603b628b8cto with $UUID make it more readable:
# cat /opt/nessus/var/nessus/logs/nessusd.messages
[Thu Mar 8 13:23:58 2018][25606.1] Logfile /opt/nessus/var/nessus/logs/nessusd.messages initialized with size-based rotation
[Thu Mar 8 13:23:58 2018][25606.1] nessusd 6.11.3 (build M20104) started
[Thu Mar 8 13:23:58 2018][25606.1] Linux overcommit_memory policy is set to: 0
[Thu Mar 8 13:23:58 2018][25606.1] System has 3791MB of RAM
[Thu Mar 8 13:23:58 2018][25606.1] Disabled legacy NTP support
[Thu Mar 8 13:24:00 2018][25606.3] Setting the thread pool size to default
[Thu Mar 8 13:24:00 2018][25606.3] Nessus Web Server is running (pid=6)
[Thu Mar 8 13:24:11 2018][25606.59] nessusd-reloader: started
[Thu Mar 8 13:24:11 2018][25606.1] nessusd is ready
[Thu Mar 8 13:24:11 2018][25606.1] Redirecting debugging output to /opt/nessus/var/nessus/logs/nessusd.dump
[Thu Mar 8 13:24:22 2018][25606.3] Reloading the Nessus Web Server as nessusd was reloaded
[Thu Mar 8 13:24:22 2018][25606.3] Nessus Web Server is running (pid=67)
[Thu Mar 8 13:26:03 2018][25606.130][JOB_NAME=test_scan][JOB_UUID=$UUID] User admin starts a new scan ($UUID)
[Thu Mar 8 13:26:03 2018][25606.130][JOB_NAME=test_scan][JOB_UUID=$UUID] user admin starts a new scan. Target(s) : test-linux-host01, with max_hosts = 100 and max_checks = 5
[Thu Mar 8 13:26:03 2018][25606.130][JOB_NAME=test_scan][JOB_UUID=$UUID] Full audit trail enabled
[Thu Mar 8 13:26:03 2018][25606.130][JOB_NAME=test_scan][JOB_UUID=$UUID] user admin : testing test-linux-host01 (192.168.56.12) [131]
[Thu Mar 8 13:27:21 2018][25606.131][JOB_NAME=test_scan][JOB_UUID=$UUID] Finished testing test-linux-host01. Time : 77.58 secs
[Thu Mar 8 13:27:21 2018][25606.130][JOB_NAME=test_scan][JOB_UUID=$UUID] user admin : test complete
[Thu Mar 8 13:27:21 2018][25606.130][JOB_NAME=test_scan][JOB_UUID=$UUID] Scan done: 1 hosts up
[Thu Mar 8 13:27:21 2018][25606.130][JOB_NAME=test_scan][JOB_UUID=$UUID] Total time to scan all hosts : 78 seconds
[Thu Mar 8 13:27:21 2018][25606.3] Task $UUID is finished
Not very interesting. We see that the tasks were started and completed.
Log scan details (log whole attack)
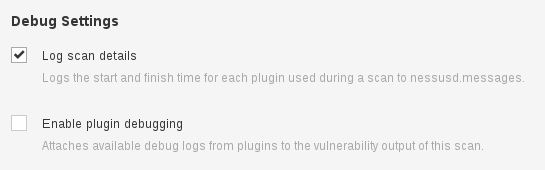
Now I go to the profile settings -> Advanced and set log scan details:
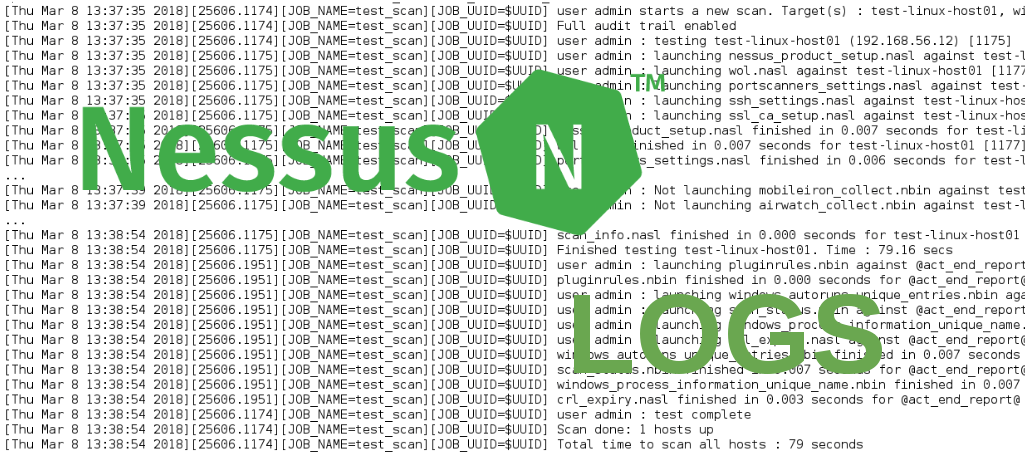
I restart the scan, wait a minute and look at the logs again:
[Thu Mar 8 13:37:35 2018][25606.1174][JOB_NAME=test_scan][JOB_UUID=$UUID] User admin starts a new scan ($UUID)
[Thu Mar 8 13:37:35 2018][25606.1174][JOB_NAME=test_scan][JOB_UUID=$UUID] user admin starts a new scan. Target(s) : test-linux-host01, with max_hosts = 100 and max_checks = 5
[Thu Mar 8 13:37:35 2018][25606.1174][JOB_NAME=test_scan][JOB_UUID=$UUID] Full audit trail enabled
[Thu Mar 8 13:37:35 2018][25606.1174][JOB_NAME=test_scan][JOB_UUID=$UUID] user admin : testing test-linux-host01 (192.168.56.12) [1175]
[Thu Mar 8 13:37:35 2018][25606.1175][JOB_NAME=test_scan][JOB_UUID=$UUID] user admin : launching nessus_product_setup.nasl against test-linux-host01 [1176]
[Thu Mar 8 13:37:35 2018][25606.1175][JOB_NAME=test_scan][JOB_UUID=$UUID] user admin : launching wol.nasl against test-linux-host01 [1177]
[Thu Mar 8 13:37:35 2018][25606.1175][JOB_NAME=test_scan][JOB_UUID=$UUID] user admin : launching portscanners_settings.nasl against test-linux-host01 [1178]
[Thu Mar 8 13:37:35 2018][25606.1175][JOB_NAME=test_scan][JOB_UUID=$UUID] user admin : launching ssh_settings.nasl against test-linux-host01 [1179]
[Thu Mar 8 13:37:35 2018][25606.1175][JOB_NAME=test_scan][JOB_UUID=$UUID] user admin : launching ssl_ca_setup.nasl against test-linux-host01 [1180]
[Thu Mar 8 13:37:35 2018][25606.1175][JOB_NAME=test_scan][JOB_UUID=$UUID] nessus_product_setup.nasl finished in 0.007 seconds for test-linux-host01 [1176]
[Thu Mar 8 13:37:35 2018][25606.1175][JOB_NAME=test_scan][JOB_UUID=$UUID] wol.nasl finished in 0.007 seconds for test-linux-host01 [1177]
[Thu Mar 8 13:37:35 2018][25606.1175][JOB_NAME=test_scan][JOB_UUID=$UUID] portscanners_settings.nasl finished in 0.006 seconds for test-linux-host01 [1178]
...
[Thu Mar 8 13:37:39 2018][25606.1175][JOB_NAME=test_scan][JOB_UUID=$UUID] user admin : Not launching mobileiron_collect.nbin against test-linux-host01 because the key Host/MDM/MobileIron/ssl is missing (this is not an error)
[Thu Mar 8 13:37:39 2018][25606.1175][JOB_NAME=test_scan][JOB_UUID=$UUID] user admin : Not launching airwatch_collect.nbin against test-linux-host01 because the key Host/MDM/AirWatch/hostname is missing (this is not an error)
...
[Thu Mar 8 13:38:54 2018][25606.1175][JOB_NAME=test_scan][JOB_UUID=$UUID] scan_info.nasl finished in 0.000 seconds for test-linux-host01 [1949]
[Thu Mar 8 13:38:54 2018][25606.1175][JOB_NAME=test_scan][JOB_UUID=$UUID] Finished testing test-linux-host01. Time : 79.16 secs
[Thu Mar 8 13:38:54 2018][25606.1951][JOB_NAME=test_scan][JOB_UUID=$UUID] user admin : launching pluginrules.nbin against @act_end_report@ [1952]
[Thu Mar 8 13:38:54 2018][25606.1951][JOB_NAME=test_scan][JOB_UUID=$UUID] pluginrules.nbin finished in 0.000 seconds for @act_end_report@ [1952]
[Thu Mar 8 13:38:54 2018][25606.1951][JOB_NAME=test_scan][JOB_UUID=$UUID] user admin : launching windows_autoruns_unique_entries.nbin against @act_end_report@ [1953]
[Thu Mar 8 13:38:54 2018][25606.1951][JOB_NAME=test_scan][JOB_UUID=$UUID] user admin : launching scan_status.nbin against @act_end_report@ [1954]
[Thu Mar 8 13:38:54 2018][25606.1951][JOB_NAME=test_scan][JOB_UUID=$UUID] user admin : launching windows_process_information_unique_name.nbin against @act_end_report@ [1955]
[Thu Mar 8 13:38:54 2018][25606.1951][JOB_NAME=test_scan][JOB_UUID=$UUID] user admin : launching crl_expiry.nasl against @act_end_report@ [1956]
[Thu Mar 8 13:38:54 2018][25606.1951][JOB_NAME=test_scan][JOB_UUID=$UUID] windows_autoruns_unique_entries.nbin finished in 0.007 seconds for @act_end_report@ [1953]
[Thu Mar 8 13:38:54 2018][25606.1951][JOB_NAME=test_scan][JOB_UUID=$UUID] scan_status.nbin finished in 0.007 seconds for @act_end_report@ [1954]
[Thu Mar 8 13:38:54 2018][25606.1951][JOB_NAME=test_scan][JOB_UUID=$UUID] windows_process_information_unique_name.nbin finished in 0.007 seconds for @act_end_report@ [1955]
[Thu Mar 8 13:38:54 2018][25606.1951][JOB_NAME=test_scan][JOB_UUID=$UUID] crl_expiry.nasl finished in 0.003 seconds for @act_end_report@ [1956]
[Thu Mar 8 13:38:54 2018][25606.1174][JOB_NAME=test_scan][JOB_UUID=$UUID] user admin : test complete
[Thu Mar 8 13:38:54 2018][25606.1174][JOB_NAME=test_scan][JOB_UUID=$UUID] Scan done: 1 hosts up
[Thu Mar 8 13:38:54 2018][25606.1174][JOB_NAME=test_scan][JOB_UUID=$UUID] Total time to scan all hosts : 79 seconds
Ok, now it’s better. We can see what plugins was launched and how long they were running. For example, portscanners_settings.nasl. We also can see which plugins were not launched and why:
Not launching mobileiron_collect.nbin against test-linux-host01 because the key Host/MDM/MobileIron/ssl is missing
The same information that you get from Audit Trail in GUI:

Nice.
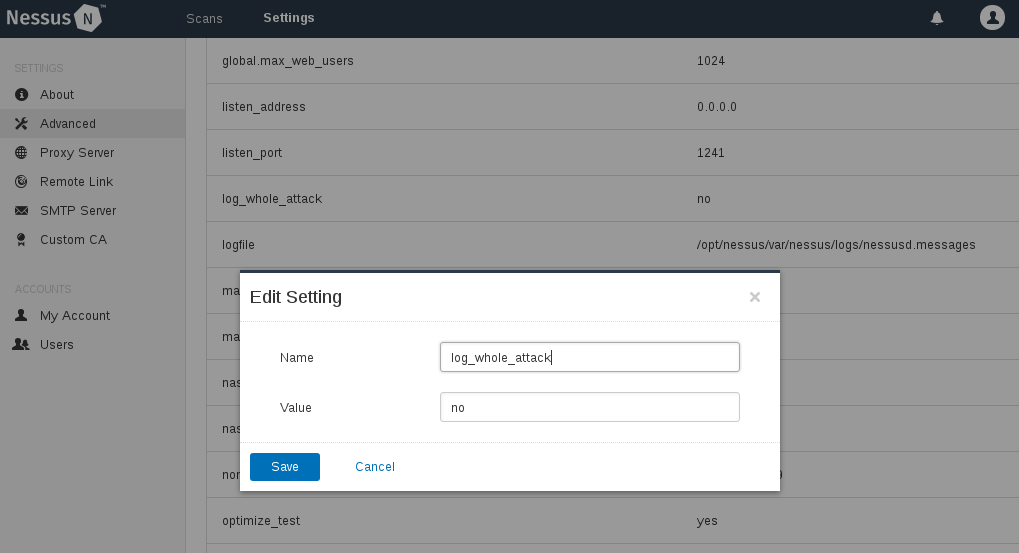
If you want to use this kind of logs by default you may set log_whole_attack = yes in scanner Settings -> Advanced. By default it is set to “no”:
Plugin debugging
But what about “Enable plugin debugging” option?
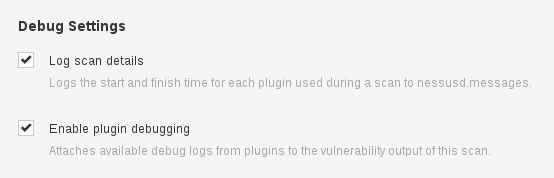
The thing is that some plugins leave debug logs and if you select “Enable plugin debugging” checkbox and choose plugin 84239, you can see logs for these plugins in GUI:
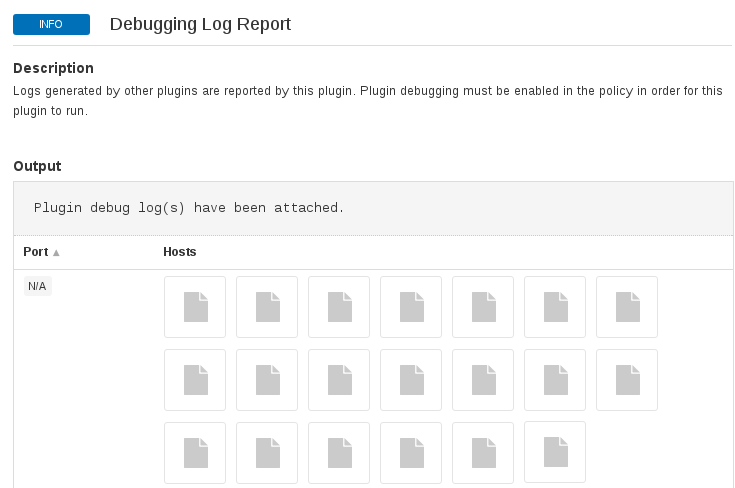
I thought maybe they attach these logs to the XML Nessus V2 scan reports, but unfortunately not. They have only hashes there:
<ReportItem port="0" svc_name="general" protocol="tcp" severity="0" pluginID="84239" pluginName="Debugging Log Report" pluginFamily="Settings">
<agent>all</agent>
<always_run>1</always_run>
<description>Logs generated by other plugins are reported by this plugin. Plugin debugging must be enabled in the policy in order for this plugin to run.</description>
<fname>debug_log_report.nasl</fname>
<plugin_modification_date>2017/09/27</plugin_modification_date>
<plugin_name>Debugging Log Report</plugin_name>
<plugin_publication_date>2015/06/17</plugin_publication_date>
<plugin_type>combined</plugin_type>
<risk_factor>None</risk_factor>
<script_version>1.6</script_version>
<solution>n/a</solution>
<synopsis>This plugin gathers the logs written by other plugins and reports them.</synopsis>
<plugin_output>Plugin debug log(s) have been attached.</plugin_output>
<attachment name="netstat_portscan.log" type="text">1bfa62c26e3fc85c7f723fc71ed51242</attachment>
<attachment name="netstat_portscan_ssh_pkt.log" type="text">efc46ed6b6afd2526973c2b341f23548</attachment>
<attachment name="database_settings.log" type="text">9aeb2035bf5932bf035c8e0e2bcebe33</attachment>
<attachment name="ipthreat_lookup_netstat.log" type="text">fd3a49f1d41f5b2f7779bf094c5cdf22</attachment>
<attachment name="bad_rdns_resolv_func.log" type="text">ea04d666096adbcca7006600c64f705b</attachment>
<attachment name="Satellite 6 Debugging" type="text">f6426368a5e8c45f2e01c8e709ad6865</attachment>
<attachment name="ssh_check_compression.log" type="text">73af33f083fea22f4c73dd4d8b2f4fee</attachment>
<attachment name="os_fingerprint_ssh_netconf.log" type="text">fe11d130f8958219e9278a5dd07e37b4</attachment>
<attachment name="os_fingerprint_ssh_netconf_ssh_pkt.log" type="text">3ef1233d9cedee3f40dcc0c1fe3fc650</attachment>
<attachment name="ssh_detect.log" type="text">64bfc9d3284fff2c41d3ab61a3535b88</attachment>
<attachment name="ssh_supported_algorithms.log" type="text">cb79c6cfc58147ccaea1d46e838bd35d</attachment>
<attachment name="ssh_supermicro.log" type="text">6987129adadb0dbc1e4c9ec330ebf294</attachment>
<attachment name="ssh_get_info.log" type="text">9e242883b359e849e077a342c3128f12</attachment>
<attachment name="ssh_get_info_ssh_pkt.log" type="text">45466b800ea45d66bda28f026f215514</attachment>
<attachment name="bios_get_info_ssh.log" type="text">9e242883b359e849e077a342c3128f12</attachment>
<attachment name="bios_get_info_ssh_ssh_pkt.log" type="text">45466b800ea45d66bda28f026f215514</attachment>
<attachment name="unix_file_content_compliance_check.nbin" type="text">970e89bb481758a0dac8b68a476f1dc4</attachment>
<attachment name="bash_remote_code_execution.log" type="text">2fcf9b7ed71305d4d1c862b2357bb0aa</attachment>
<attachment name="bash_remote_code_execution_ssh_pkt.log" type="text">bd2a823e35bb387cafe06a94aa2a2bea</attachment>
<attachment name="patches_summary.log" type="text">6ab0749fa2954cffeddba76d1e4d251c</attachment>
</ReportItem>
In conclusion
The logs are informative enough to understand if some particular plugin was launched and how long it was running. You can see “launching”, “not launching” and “finished” plugin events. Unfortunately, no further details are available. For example, you will not see initialization of the variables in KB. It’s a pity.

Hi! My name is Alexander and I am a Vulnerability Management specialist. You can read more about me here. Currently, the best way to follow me is my Telegram channel @avleonovcom. I update it more often than this site. If you haven’t used Telegram yet, give it a try. It’s great. You can discuss my posts or ask questions at @avleonovchat.
А всех русскоязычных я приглашаю в ещё один телеграмм канал @avleonovrus, первым делом теперь пишу туда.
Pingback: Potential RCE in Nessus 7 and attacks on Vulnerability Scanners | Alexander V. Leonov
/opt/nessus_agent/var/nessus/log.json
Add “debug” to the tags
You’re welcome 😉