Tag Archives: Grafana

I generated a Vulristics report on the April Linux Patch Wednesday

I generated a Vulristics report on the April Linux Patch Wednesday
I generated a Vulristics report on the April Linux Patch WednesdayI generated a Vulristics report on the April Linux Patch WednesdayI generated a Vulristics report on the April Linux Patch WednesdayI generated a Vulristics report on the April Linux Patch WednesdayI generated a Vulristics report on the April Linux Patch WednesdayI generated a Vulristics report on the April Linux Patch Wednesday

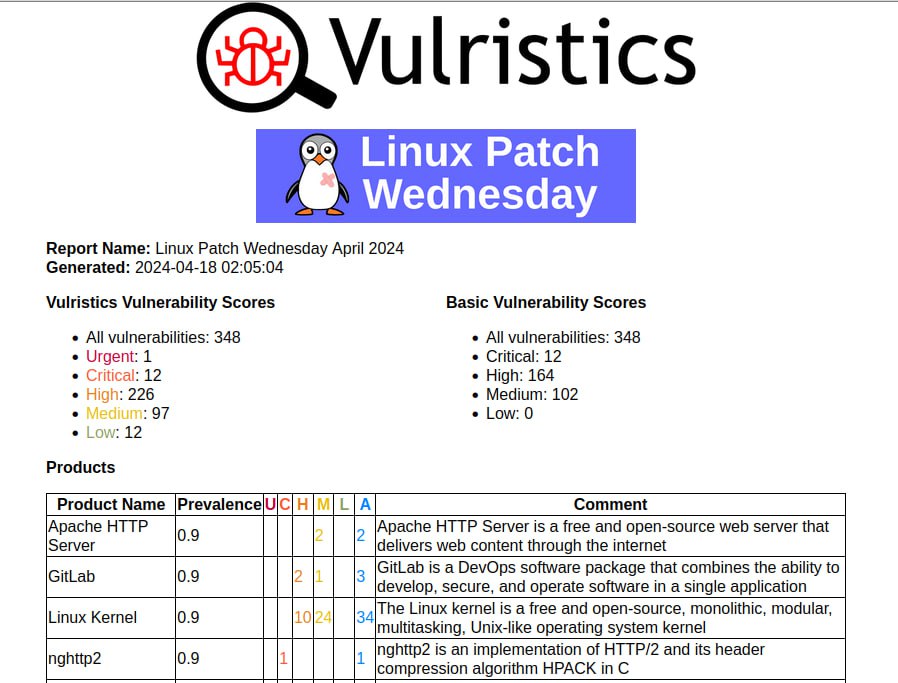
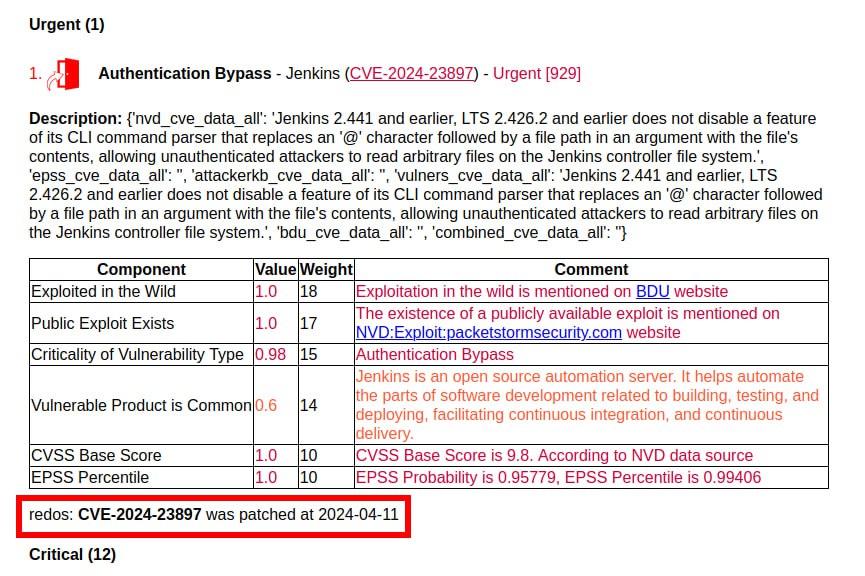
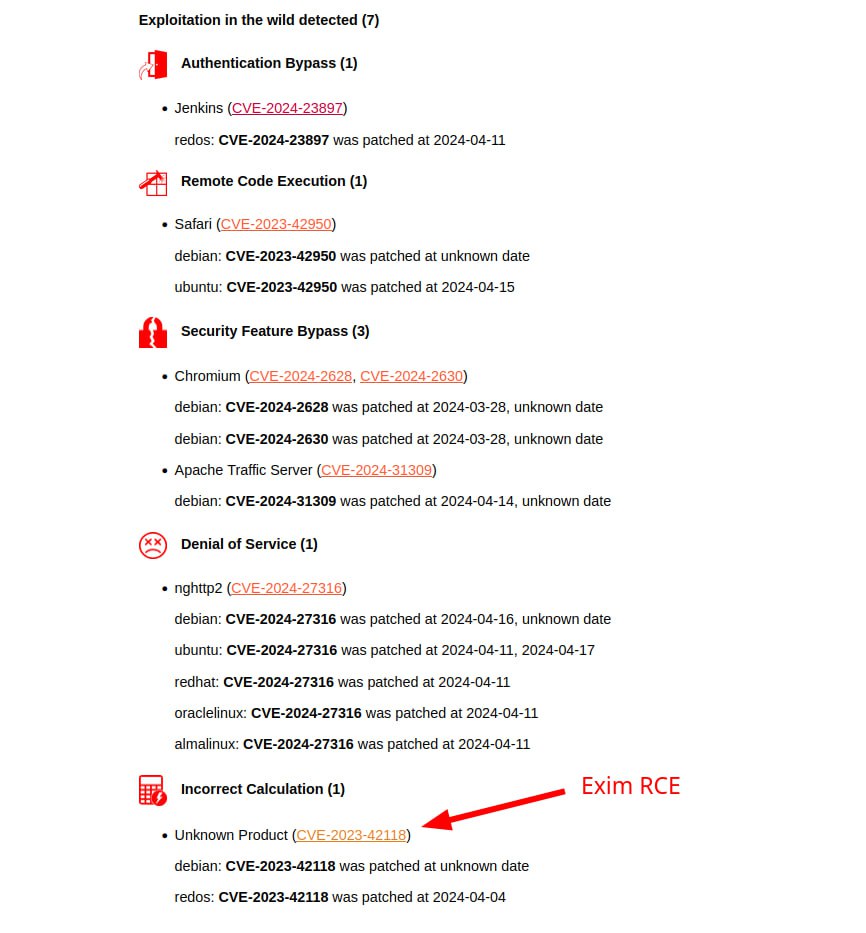
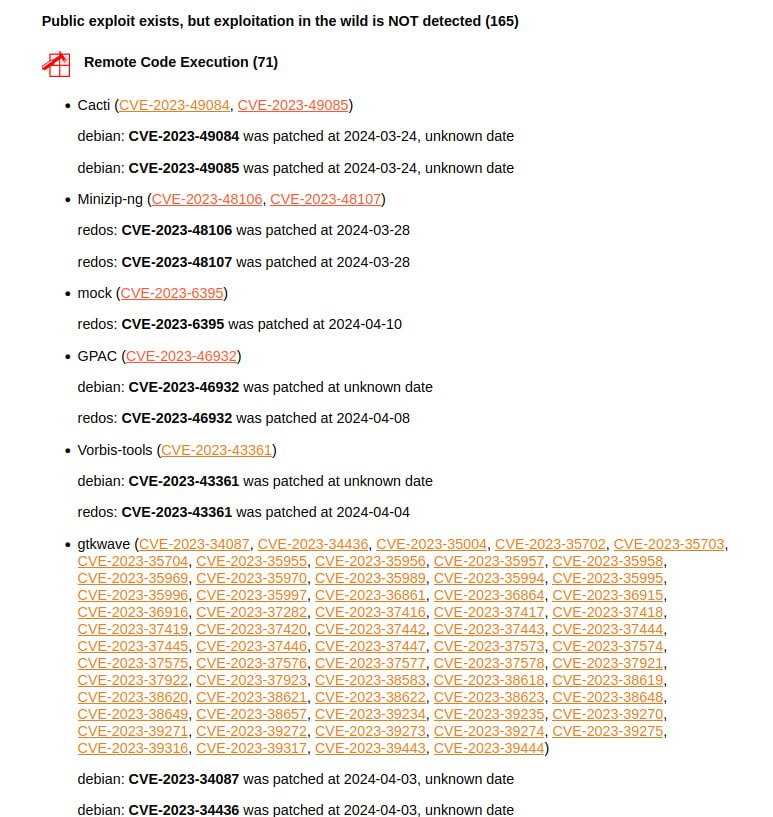
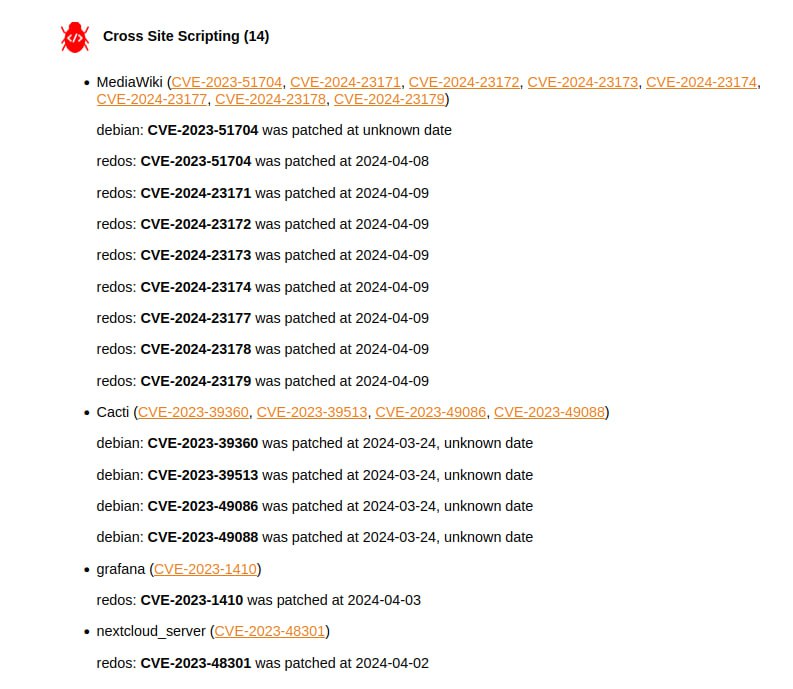
I generated a Vulristics report on the April Linux Patch Wednesday. Over the past month, Linux vendors have begun releasing patches for a record number of vulnerabilities – 348. There are signs of exploitation in the wild for 7 vulnerabilities (data on incidents from the FSTEC BDU). Another 165 have a link to an exploit or a sign of the existence of a public/private exploit.

Let’s start with 7 vulnerabilities with signs of exploitation in the wild and exploits:

🔻 The trending January vulnerability Authentication Bypass – Jenkins (CVE-2024-23897) unexpectedly appeared in the TOP. As far as I understand, Linux distributions usually do not include Jenkins packages in the official repositories and, accordingly, do not add Jenkins vulnerability detection rules to their OVAL content. Unlike the Russian Linux distribution RedOS. Therefore, RedOS has the earliest fix timestamp for this vulnerability.

🔻 2 RCE vulnerabilities. The most interesting of them is Remote Code Execution – Exim (CVE-2023-42118). When generating the report, I deliberately did not take into account the vulnerability description and product names from the BDU database (flags –bdu-use-product-names-flag, –bdu-use-vulnerability-descriptions-flag set to False). Otherwise, the report would be partly in English and partly in Russian. But it turned out that so far only BDU has an adequate description of this vulnerability. 🤷‍♂️ You need to take a closer look at this vulnerability because Exim is a fairly popular mail server. The second RCE vulnerability is in the web browser, Remote Code Execution – Safari (CVE-2023-42950).

🔻2 DoS vulnerabilities. Denial of Service – nghttp2/Apache HTTP Server (CVE-2024-27316) and Denial of Service – Apache Traffic Server (CVE-2024-31309). The second is classified in the report as Security Feature Bypass, but this is due to incorrect CWE in NVD (CWE-20 – Improper Input Validation)

🔻 2 browser vulnerabilities Security Feature Bypass – Chromium (CVE-2024-2628, CVE-2024-2630)

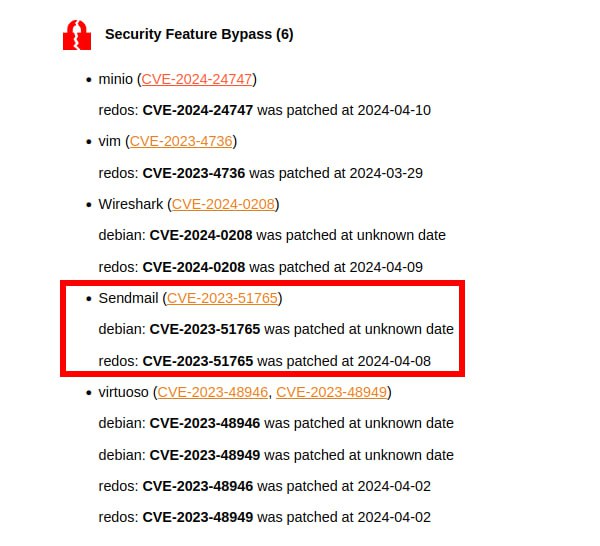
Among the vulnerabilities for which there are only signs of the existence of exploits so far, you can pay attention to the following:

🔸 A large number of RCE vulnerabilities (71). Most of them are in the gtkwave product. This is a viewer for VCD (Value Change Dump) files, which are typically created by digital circuit simulators. Also, the Remote Code Execution – Cacti (CVE-2023-49084, CVE-2023-49085) vulnerabilities look dangerous. Cacti is a solution for monitoring servers and network devices.

🔸 Security Feature Bypass – Sendmail (CVE-2023-51765). Allows an attacker to inject email messages with a spoofed MAIL FROM address.

🔸 A pack of Cross Site Scripting vulnerabilities in MediaWiki, Cacti, Grafana, Nextcloud.

There is a lot to explore this time. 🤩

🗒 April Linux Patch Wednesday

На русском

Vulnerability Intelligence based on media hype. It works? Grafana LFI and Log4j “Log4Shell” RCE

Vulnerability Intelligence based on media hype. It works? Grafana LFI and Log4j “Log4Shell” RCE. Hello everyone! In this episode, I want to talk about vulnerabilities, news and hype. The easiest way to get timely information on the most important vulnerabilities is to just read the news regularly, right? Well, I will try to reflect on this using two examples from last week.

I have a security news telegram channel https://t.me/avleonovnews that is automatically updated by a script using many RSS feeds. And the script even highlights the news associated with vulnerabilities, exploits and attacks.

And last Tuesday, 07.02, a very interesting vulnerability in Grafana was released.

Continue reading

How to list, create, update and delete Grafana dashboards via API

How to list, create, update and delete Grafana dashboards via API. I have been a Splunk guy for quite some time, 4 years or so. I have made several blog posts describing how to work with Splunk in automated manner (see in appendix). But after their decision to stop their business in Russia last year, including customer support and selling software and services, it was just a matter of time for me to start working with other dashboarding tools.

How to list, create, update and delete Grafana dashboards via API

For me, Grafana has become such a tool. In this post I want to describe the basic API operations with Grafana dashboards, which are necessary if you need to create and update dozens and hundreds of dashboards. Doing all this in the GUI will be painful. Grafana has a pretty logical and well-documented API. The only tricky moments I had were getting a list of all dashboard and editing an existing dashboard.

Continue reading

Zbrunk search launcher and event types statistics

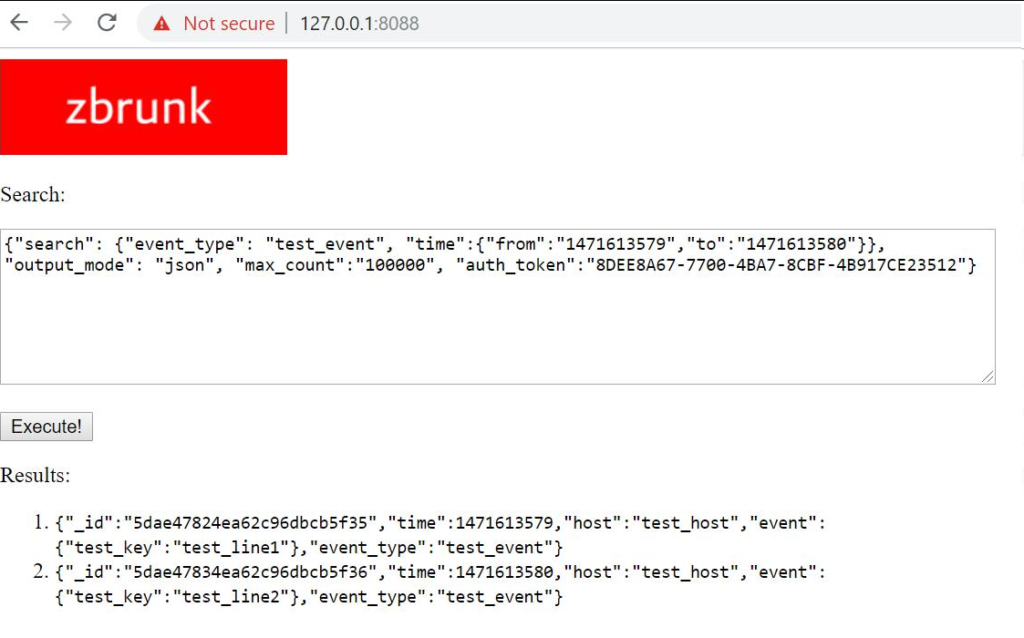
Zbrunk search launcher and event types statistics. I also changed the priorities. Now I think it would be better not to integrate with Grafana, but to create own dashboards and GUI. And to begin with, I created a simple interface for Searching (and Deleting) events.

upd. 16.12.2019

A small update on Zbrunk. First of all, I created a new API call that returns a list of object types in the database and number of this types for a certain period of time. Without it, debugging was rather inconvenient.

$ curl -k https://127.0.0.1:8088/services/searcher -d '{"get_types":"True", "search": {"time":{"from":"1471613579","to":"1471613580"}}, "output_mode": "json", "max_count":"10000000", "auth_token":"8DEE8A67-7700-4BA7-8CBF-4B917CE23512"}'

{"results": ["test_event"], "results_count": 1, "all_results_count": 0, "text": "Types found", "code": 0}

I also added some examples of working with Zbrunk http API from python3. Rewriting them from pure curl was not so trivial. ? Flask is rather moody, so I had to abandon the idea of making requests exactly the same as in Splunk. ? But the differences are cosmetic. It is now assumed that events will be passed to collector in valid json (not as a file with json events separated by ‘\n’). I also send all params of requests as json, not data. But for the compatibility reasons previous curl examples will also work. ?

Zbrunk universal data analysis system

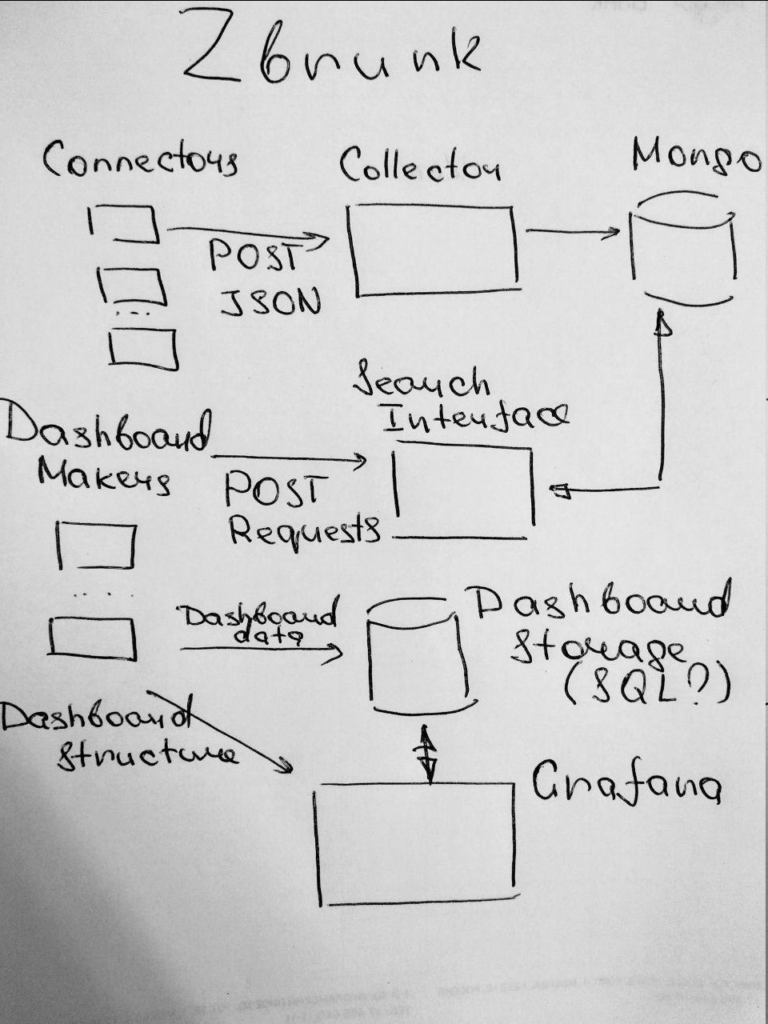
Zbrunk universal data analysis system. Zbrunk project (github) began almost like a joke. And in a way it is? In short, my friends and I decided to make an open-source (MIT license) tool, which will be a kind of alternative to Splunk for some specific tasks.

Zbrunk logo

So, it will be possible to:

  • Put structured JSON events in Zbrunk using http collector API
  • Get the events from Zbrunk using http search API
  • Make information panels based on these search requests and place them on dashboards

Why is it necessary? Well, I’ve worked a lot with Splunk in recent years. I like the main concepts, and I think working with the events is a very effective and natural way of processing and presenting data. But for my tasks (Asset Management, Compliance Management, Vulnerability Management) with several hundred megabytes of raw data per day to process and dashboards that need to be updated once or several times a day Splunk felt like an overkill. You really don’t need such performance for these tasks.

And, considering the price, it only makes sense if your organization already uses Splunk for other tasks. After Splunk decision to leave Russian market, this became even more obvious, so many people began to look for alternatives for possible and, as far as possible, painless migration.

We are realistic, the performance and search capabilities of Zbrunk will be MUCH worse. It’s impossible to make such universal and effective solution as a pet project without any resources. So, don’t expect something that will process terabytes of logs in near real time, the goal is completely different. But if you want same basic tool to make dashboards, it worth a try. ?

Now, after first weekend of coding and planning it’s possible to send events to Zbrunk just like you do it using the Splunk HTTP Event Collector and they appear in MongoDB:

$ echo -e '{"time":"1471613579", "host":"test_host", "event":{"test_key":"test_line1"}}\n{"time":"1471613580", "host":"test_host", "event":{"test_key":"test_line2"}}' > temp_data
$ curl -k https://127.0.0.1:8088/services/collector -H 'Authorization: Zbrunk 8DEE8A67-7700-4BA7-8CBF-4B917CE2352B' -d @temp_data
{"text": "Success", "code": 0}

In Mongo:

> db.events.find()
{ "_id" : ObjectId("5d62d7061600085d80bb1ea8"), "time" : "1471613579", "host" : "test_host", "event" : { "test_key" : "test_line1" }, "event_type" : "test_event" }
{ "_id" : ObjectId("5d62d7061600085d80bb1ea9"), "time" : "1471613580", "host" : "test_host", "event" : { "test_key" : "test_line2" }, "event_type" : "test_event" }

Thus, it will be very easy to use your existing custom connectors if you already have some. The next step is to make basic http search API, prepare dashboard data using these search requests and somehow show these dashboards, for example, in Grafana. Stay tuned and welcome to participate. ?

zbrunk_madskillz.jpg