
Export anything to Splunk with HTTP Event Collector. In a previous post I described how to export Nessus scan reports to Splunk server using standard app. Today let’s see how to export any structured data presented in JSON, including of course Nessus scan reports, to Splunk using HTTP Event Collector.
First of all, we should create new HTTP Event Collector
http://your_splunk_host:8000/en-US/manager/launcher/http-eventcollector
And press “New Token” button
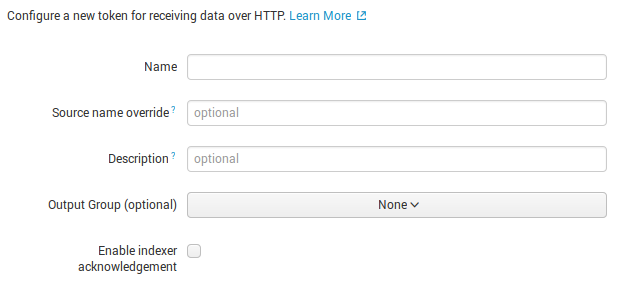
I set only name “New_HTTP_token”. Press “Next” button.
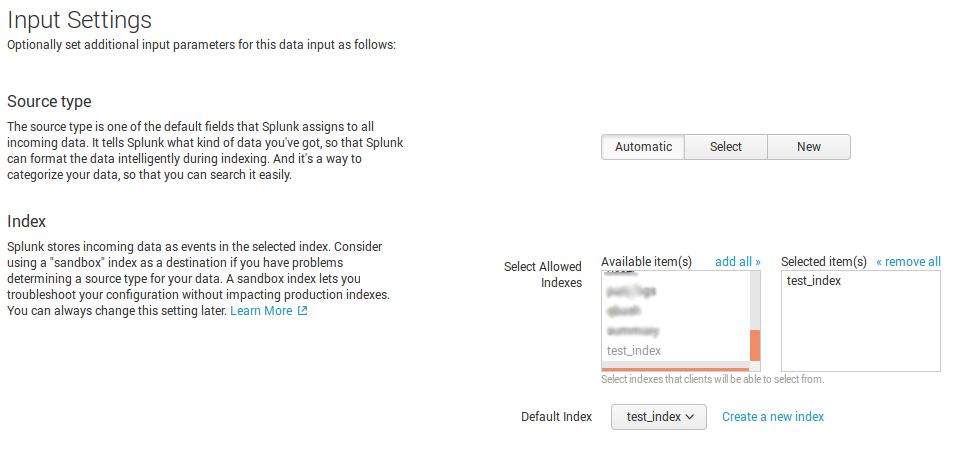
In “Settings” you need to specify in which index exported data will be stored. I created a new one “test_index”.
Reviewing our very basic settings.
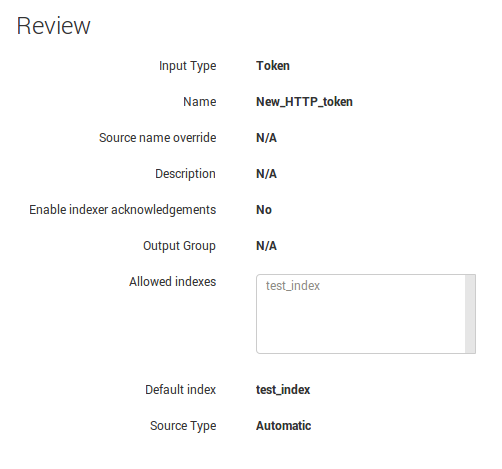
And finally we get a token we can use in for authentication in our request.
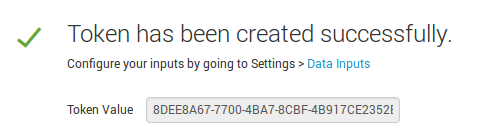
HTTP Event Collector uses 8088 tcp port. Don’t forget to open it in your firewall.
For FirewallD in CentOS7:
# firewall-cmd --add-port=8088/tcp --permanent

# firewall-cmd --reload

# firewall-cmd --list-all-zones

...

public (default, active)

interfaces: enp3s0f0

sources:

services: dhcpv6-client ssh

ports: 8088/tcp

masquerade: no

forward-ports:

icmp-blocks:

rich rules:

...
For CentOS 6 and iptables you can find an example here: Making vulnerable OpenSSL scanning target.
Or, now we are ready to send something to our Splunk server. All our request should have parameters: time, host, and event.
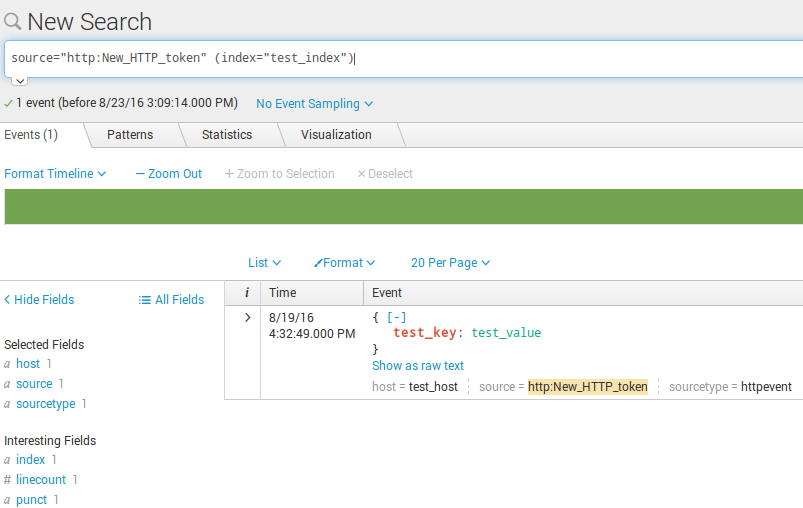
$ echo '{"time":"1471613569", "host":"test_host", "event":{"test_key":"test_value"}}' > temp.json

$ curl -k https://your_splunk_host:8088/services/collector -H 'Authorization: Splunk 8DEE8A67-7700-4BA7-8CBF-4B917CE2352B' -d @temp.json

{"text":"Success","code":0}
Here it is in Splunk search interface:
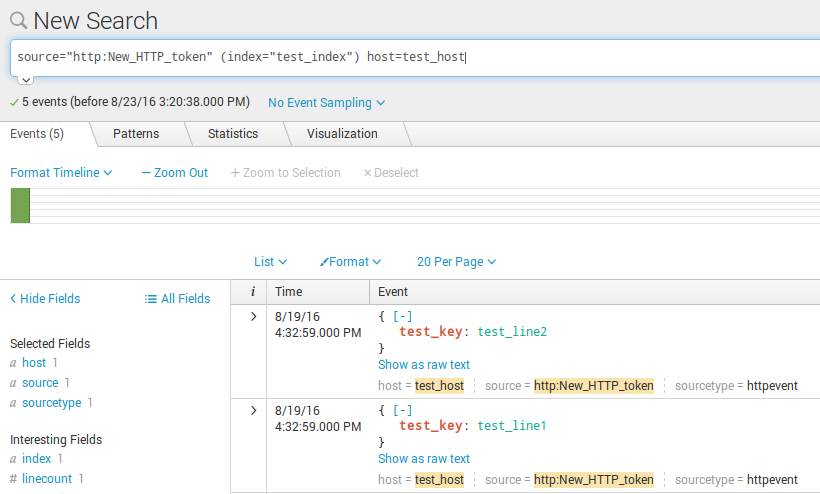
But putting one event per request might be slow. Splunk lets you send a package of several events in the json, one per line. Not a very nice format, but why not.
$ echo -e '{"time":"1471613579", "host":"test_host", "event":{"test_key":"test_line1"}}\n{"time":"1471613580", "host":"test_host", "event":{"test_key":"test_line2"}}' > temp.json

$ curl -k https://your_splunk_host:8088/services/collector -H 'Authorization: Splunk 8DEE8A67-7700-4BA7-8CBF-4B917CE2352B' -d @temp.json

{"text":"Success","code":0}
Here we can see two events:
Now we will try to send something from Nessus vulnerability scan report.
Where can I get a timestamp?
I take timestamp of the scan start via API:
...

"creation_date": 1444816022,

...
Read more at “Retrieving scan results through Nessus API”
Where can I get a host name?
I take it in scan report:
...

<ReportHost name="192.168.0.1">

...
Read more at “Nessus v2 xml report format”
I make event from <ReportItem>…</ ReportItem> converting it to JSON. So, the complete request look like this:
$ echo -e '{"time":"1444816022", "host":"192.168.0.1", "event":{"cvss_temporal_vector":["CVSS2#E:ND/RL:OF/RC:C"], "protocol":"tcp", "cvss_base_score":"6.8", "exploitability_ease":["No known exploits are available"], "solution":"Upgrade to VLC version 2.0.9 or later.", "cvss_temporal_score":["5.9"], "plugin_output":" Path : C:Program Files (x86)VideoLANVLC[newline] Installed version : 2.0.7[newline] Fixed version : 2.0.9", "port":"445", "xref":["OSVDB:98063"], "severity":"2", "script_version":"$Revision: 1.1 $", "osvdb":["98063"], "patch_publication_date":"2013/08/25", "synopsis":"The remote Windows host contains a media player that is affected by a buffer overflow vulnerability.", "risk_factor":"Medium", "pluginID":"70560", "fname":"vlc_2_0_9.nasl", "svc_name":"cifs", "description":"The version of VLC media player installed on the remote host is earlier than 2.0.9. It is, therefore, affected by a buffer overflow vulnerability in 'packetizer/mpeg4audio.c'.", "see_also":["http://www.videolan.org/developers/vlc-branch/NEWS"], "bid":["62724"], "plugin_modification_date":"2013/10/23", "plugin_name":"VLC < 2.0.9 Buffer Overflow", "plugin_publication_date":"2013/10/23", "cvss_vector":"CVSS2#AV:N/AC:M/Au:N/C:P/I:P/A:P", "vuln_publication_date":["2013/09/30"], "cpe":["cpe:/a:videolan:vlc_media_player"], "pluginName":"VLC < 2.0.9 Buffer Overflow", "exploit_available":["false"], "cve":["CVE-2013-4388"], "pluginFamily":"Windows", "plugin_type":"local"}}' > temp.json

{"text":"Success","code":0}
And here it is in Splunk.
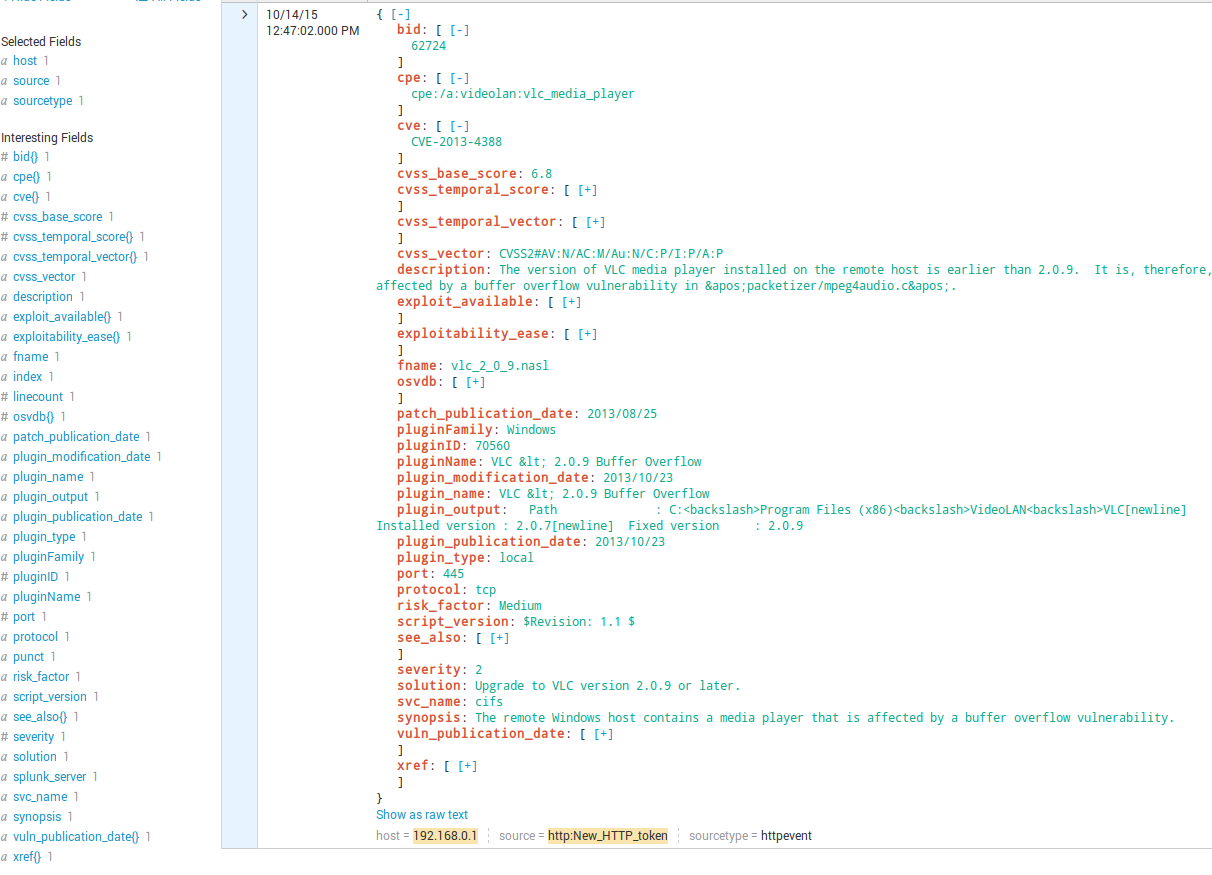
You can compare it with “nessus:scan” from “Splunk Add-on for Tenable“. It’s much more informative. You can see all attributes nasl plugin has as well as plugin output. On the right panel statistics for attributes is be displayed. You can make requests the same way you do it in Nessus/SecurityCenter GUI.
Warning! If you try to send big files to Splunk via HTTP Event Collector you will probably get max_content_length error.
You change the limit (in bytes) in $SPLUNK_HOME/etc/system/default/limits.conf (/opt/splunk/etc/system/default/limits.conf)
[http_input]

# The max number of tokens reported by logging input metrics.

max_number_of_tokens = 10000

# The interval (in seconds) of logging input metrics report.

metrics_report_interval = 60

# The max request content length.

#max_content_length = 1000000

max_content_length = 10000000000
And then restart:
http://your_splunk_host:8000/en-US/manager/launcher/control
“Click the button below to restart Splunk”.

Hi! My name is Alexander and I am a Vulnerability Management specialist. You can read more about me here. Currently, the best way to follow me is my Telegram channel @avleonovcom. I update it more often than this site. If you haven’t used Telegram yet, give it a try. It’s great. You can discuss my posts or ask questions at @avleonovchat.
А всех русскоязычных я приглашаю в ещё один телеграмм канал @avleonovrus, первым делом теперь пишу туда.
Pingback: Exporting Nessus scan results to Splunk | Alexander V. Leonov
Pingback: Qualys Vulnerability Management GUI and API | Alexander V. Leonov
Pingback: Tenable.IO VM: connected scanners and asset UUIDs | Alexander V. Leonov
Pingback: Tracking software versions using Nessus and Splunk | Alexander V. Leonov
Pingback: ISACA Moscow Vulnerability Management Meetup 2017 | Alexander V. Leonov
Pingback: Parsing Nessus v2 XML reports with python | Alexander V. Leonov
hi thanks for this awesome tutorial it really helped to configure a modular input
Pingback: How to correlate different events in Splunk and make dashboards | Alexander V. Leonov
Pingback: Sending FireEye HX data to Splunk | Alexander V. Leonov
Pingback: Asset Inventory for Internal Network: problems with Active Scanning and advantages of Splunk | Alexander V. Leonov
Pingback: Retrieving IT Asset lists from NetBox via API | Alexander V. Leonov
Pingback: Splunk Discovery Day Moscow 2018 | Alexander V. Leonov
Pingback: Why Asset Management is so important for Vulnerability Management and Infrastructure Security? | Alexander V. Leonov
Pingback: How to list, create, update and delete Grafana dashboards via API | Alexander V. Leonov
I thought you should not make any changes to default folder files, instead, copy it to local folder and make the changes?