
Sending FireEye HX data to Splunk. FireEye HX is an agent-based Endpoint Protection solution. Something like an antivirus, but focused on Advanced Persistent Threats (APT). It has an appliance with GUI where you can manage the agents and see information about detected security incidents.
As with any agent-based solution, it’s necessary to ensure that the agents are installed on every supported host in your network. You may also want to analyze the alerts automatically. And for both purposes you can use Splunk. Let’s see how to do it. 😉
Note, everything bellow is for FireEye Endpoint Security (HX) 4.0.6 and Splunk 7.0.2. If you use some other version, the things may be quite different.
The main idea is following. We should present FireEye hosts and alerts data in JSON format, add some mandatory fields ans send this packages to Splunk using HTTP Event connector. Then we can process it in Splunk like I’ve shown in “How to correlate different events in Splunk and make dashboards“.
The graphical interface looks like this. As you can see there is information about active and inactive hosts:
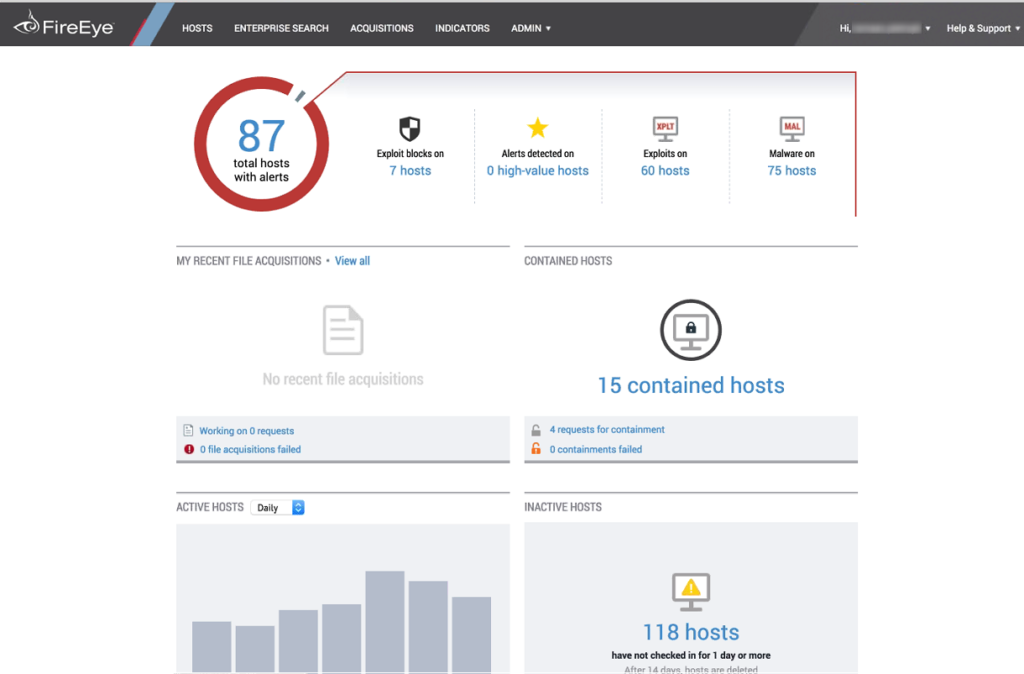
I took this image from official website (rus).
And here are the incidents detected for some host:
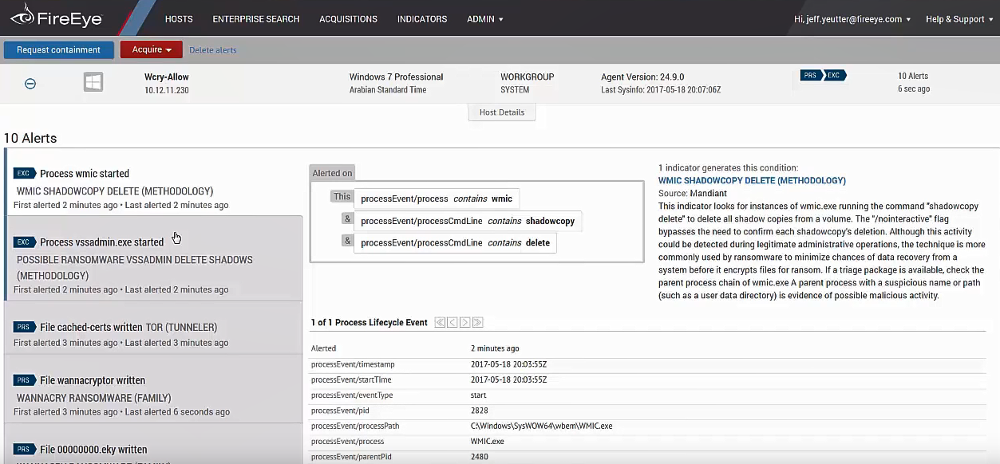
I took this image from the official video “Demo: Endpoint Security (HX) gegen WannaCry”
We will try to get this information and put it in Splunk.
Authentication in FireEye HX
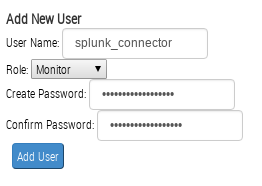
First of all, we need to create user account at https://[sever_name]:3000/login/user_accounts
Now let’s figure out how to authenticate. First way is to use basic authentication with every request:
$ curl 'https://[sever_name]:3000/hx/api/v2/version' --user 'splunk_connector:Password123' -k

{"details":[],"route":"/hx/api/v2/version","data":{"version":"2.9.24","msoVersion":"4.0.6","applianceId":"1GG51LL92CWE"},"message":"OK"}
The second way is getting authentication token:
$ curl 'https://[sever_name]:3000/hx/api/v2/token' --user 'splunk_connector:Password123' -kI

HTTP/1.1 204 No Content

Date: Thu, 26 Jul 2018 13:04:11 GMT

Server: Apache/2

Cache-Control: no-cache, no-store, must-revalidate, no-cache, no-store

Pragma: no-cache

Expires: 0

X-FeApi-Token: ILoEVTh7tN3gIj0rOIOlReE8XHti3s1vyGQFZD6KojlaAOI==

X-Frame-Options: SameOrigin
Then we can use this token like this:
$ curl 'https://[sever_name]:3000/hx/api/v2/version' -H "X-FeApi-Token: ILoEVTh7tN3gIj0rOIOlReE8XHti3s1vyGQFZD6KojlaAOI==" -k

{"details":[],"route":"/hx/api/v2/version","data":{"version":"2.9.24","msoVersion":"4.0.6","applianceId":"1GG51LL92CWE"},"message":"OK"}
The same example in python:
import requests

response = requests.get('https://[sever_name]:3000/hx/api/v2/token', verify=False, auth=('splunk_connector', 'Password123'))
token = response.headers['x-feapi-token']


headers = {
    'X-FeApi-Token': token,
}

response = requests.get('https://[sever_name]:3000/hx/api/v2/version', headers=headers, verify=False)
print(response.text)
Output:
{"details":[],"route":"/hx/api/v2/version","data":{"version":"2.9.24","msoVersion":"4.0.6","applianceId":"1GG51LL92CWE"},"message":"OK"}
Getting the hosts
It is pretty straight forward. Just send a get request to hosts page. If you set big enough limit parameter you can get all the data at once. Otherwise use several requests with offset.
import json

response = requests.get('https://[sever_name]:3000/hx/api/v2/hosts?limit=10000', headers=headers, verify=False)
entries = json.loads(response.text)['data']['entries']
print(json.dumps(entries[0], indent=4, sort_keys=True))
Output:
{
"_id": "KIXFF33N85ccBkR6qjQTS7",
"agent_version": "23.10.1",
"containment_missing_software": false,
"containment_queued": false,
"containment_state": "normal",
"domain": "COMPANY",
"excluded_from_containment": false,
"gmt_offset_seconds": 10800,
"hostname": "host1342",
"last_alert": null,
"last_alert_timestamp": null,
"last_audit_timestamp": "2018-07-26T16:49:04.000Z",
"last_poll_ip": "192.168.11.02",
"last_poll_timestamp": "2018-07-26T16:47:02.000Z",
"os": {
"bitness": "64-bit",
"patch_level": "Service Pack 1",
"platform": "win",
"product_name": "Windows 7 Professional"
},
"primary_ip_address": "192.168.11.02",
"primary_mac": "74-d4-35-12-bc-56",
"reported_clone": false,
"stats": {
"acqs": 0,
"alerting_conditions": 0,
"alerts": 0,
"exploit_alerts": 0
},
"sysinfo": {
"url": "/hx/api/v2/hosts/KIXFF33N85ccBkR6qjQTS7/sysinfo"
},
"timezone": "RTZ 2 (\u0437\u0438\u043c\u0430)",
"url": "/hx/api/v2/hosts/KIXFF33N85ccBkR6qjQTS7"
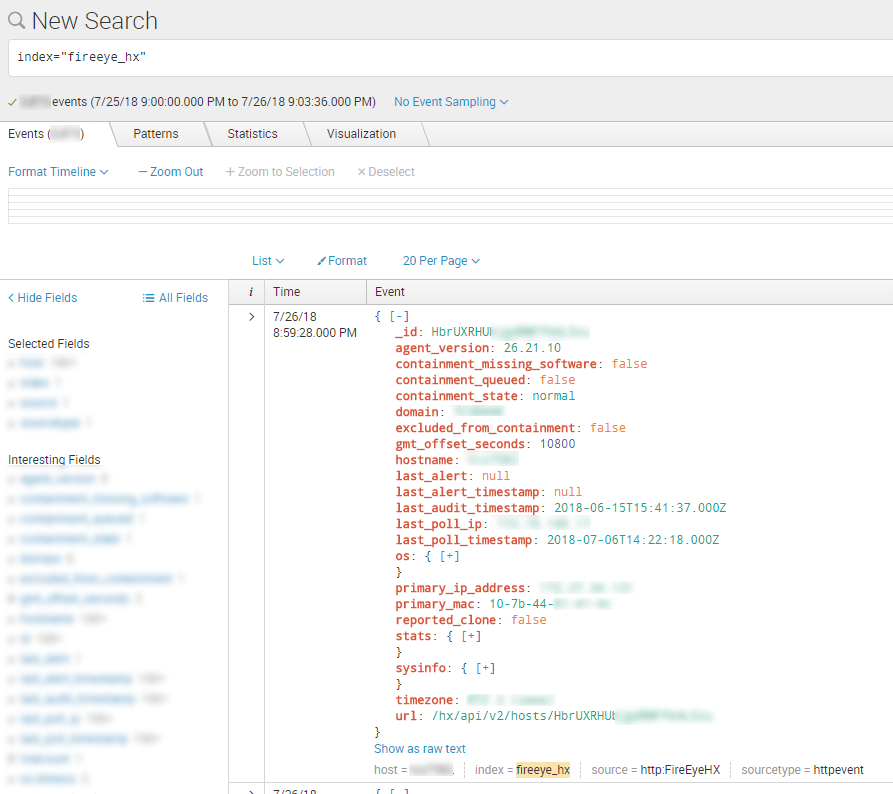
}What about INACTIVE HOSTS? I found one and it looks like this:
for entry in json.loads(response.text)['data']['entries']:
    if entry['hostname'].lower() == "host7582":
        print(json.dumps(entry, indent=4, sort_keys=True))
Output:
{
    "_id": "HbrUXRHUbjgdRMFfkAL5zu",
    "agent_version": "26.21.10",
    "containment_missing_software": false,
    "containment_queued": false,
    "containment_state": "normal",
    "domain": "COMPANY",
    "excluded_from_containment": false,
    "gmt_offset_seconds": 10800,
    "hostname": "host7582",
    "last_alert": null,
    "last_alert_timestamp": null,
    "last_audit_timestamp": "2018-06-15T15:41:37.000Z",
    "last_poll_ip": "192.168.11.01",
    "last_poll_timestamp": "2018-07-06T14:22:18.000Z",
    "os": {
        "bitness": "64-bit",
        "patch_level": "Service Pack 1",
        "platform": "win",
        "product_name": "Windows 7 Professional"
    },
    "primary_ip_address": "192.168.11.01",
    "primary_mac": "10-7b-44-81-41-4c",
    "reported_clone": false,
    "stats": {
        "acqs": 0,
        "alerting_conditions": 0,
        "alerts": 0,
        "exploit_alerts": 0
    },
    "sysinfo": {
        "url": "/hx/api/v2/hosts/HbrUXRHUbjgdRMFfkAL5zu/sysinfo"
    },
    "timezone": "RTZ 2 (\u0437\u0438\u043c\u0430)",
    "url": "/hx/api/v2/hosts/HbrUXRHUbjgdRMFfkAL5zu"
}
As you can see, there are no differences except timestamps (last_audit_timestamp, last_poll_timestamp).
Getting the Alerts
To get the alerts you should use https://[sever_name]:3000/hx/api/v2/alerts url.
One alert for Excel file analysis:
{
    "_id": 1088415,
    "agent": {
        "_id": "3rgJpaJZb6kbSpnqGpYCFv",
        "containment_state": "normal",
        "url": "/hx/api/v2/hosts/3rgJpaJZb6kbSpnqGpYCFv"
    },
    "condition": null,
    "event_at": "2018-05-10T13:39:49.031Z",
    "event_id": null,
    "event_type": null,
    "event_values": {
        "analysis_details": [
            {
                "analysis": {
                    "engine_version": "26.4.0.0",
                    "ftype": "xls",
                    "mode": "malware",
                    "rules_version": "2.95",
                    "whitelist_version": "1.43"
                },
                "detail_type": "analysis"
            },
            {
                "detail_type": "os",
                "os": {
                    "name": "windows",
                    "os-arch": "64-bit",
                    "os-language": "en-US",
                    "sp": "1",
                    "version": "6.1.7601"
                }
            },
            {
                "EXPLOITED_PROCESS": {
                    "pid": "9060",
                    "processinfo": {
                        "imagepath": "C:\\Program Files (x86)\\Microsoft Office\\Office14\\EXCEL.EXE",
                        "md5sum": "00000000000000000000000000000000",
                        "pid": "9060"
                    }
                },
                "detail_type": "EXPLOITED_PROCESS"
            },
            ...
            {
                "detail_time": "2018-05-10T13:39:49.031Z",
                "detail_type": "process",
                "process": {
                    "analysis-id": "70023",
                    "cmdline": "\"C:\\Program Files (x86)\\Microsoft Office\\Office14\\EXCEL.EXE\" /automation -Embedding",
                    "eventid": "740222533",
                    "mode": "terminated",
                    "parentname": "N/A",
                    "pid": "9060",
                    "ppid": "692",
                    "timestamp": "131704331890312774",
                    "value": "C:\\Program Files (x86)\\Microsoft Office\\Office14\\EXCEL.EXE"
                }
            },
            {
                "analysis_result": {
                    "_CONTENTS": "\nSuspicious crash due to Stack Buffer Overflow\nProtected mode for Internet Zone disabled\nIE ProtectedMode disabled\n",
                    "is_blocked": "no",
                    "is_malicious": "no"
                },
                "detail_type": "analysis_result"
            }
        ],
        "earliest_detection_time": "2018-05-10T13:39:49Z",
        "messages": [
            "Suspicious crash due to Stack Buffer Overflow",
            "Protected mode for Internet Zone disabled",
            "IE ProtectedMode disabled"
        ],
        "process_id": "9060",
        "process_name": "EXCEL.EXE"
    },
    "matched_at": "2018-05-10T13:39:49.031Z",
    "matched_source_alerts": [],
    "reported_at": "2018-05-10T13:41:09.737Z",
    "source": "EXD",
    "url": "/hx/api/v2/alerts/1088415"
}
It uses the same agent _id, so you can understand what host is affected. The result of analysis you can see in event_values -> analysis_details -> analysis_result.
Sending data to Splunk
I’m using this script for sending the hosts to Splunk. Read more in “Export anything to Splunk with HTTP Event Collector”
import requests
import json
import re

package = ""
id_to_host = dict()
for entry in entries:
    event = dict()
    event['time'] = str(functions_tools_time.get_current_ts())
    event['host'] = entry['hostname'].lower()
    event['event'] = entry
    package = package + "\n" + json.dumps(event)
    id_to_host[entry['_id']] = entry['hostname'].lower()

package = re.sub("^\n","", package)

headers = {
    'Authorization': 'Splunk s66qwe11-368f-4223-b8f6-a5ebcdf3d7c5',
}

response = requests.post('https://[splunk-host]:8088/services/collector', headers=headers, data=package, verify=False)
print(response.text)
Output:
{"text":"Success","code":0}
It’s a bit more complicated with Alarms. On the one hand, it’s a bit strange to send ALL alarm each time to Splunk. On the other hand, if we do not send all messages each time we will need to save the alerts we have already sent earlier and use earliest_detection_time as a time for Splunk event. This makes the connector more complicated. So decide for yourself. 😉 To switch from agent _id to hostname, you can use id_to_host dictionary, that I initialized in the example above.

Hi! My name is Alexander and I am a Vulnerability Management specialist. You can read more about me here. Currently, the best way to follow me is my Telegram channel @avleonovcom. I update it more often than this site. If you haven’t used Telegram yet, give it a try. It’s great. You can discuss my posts or ask questions at @avleonovchat.
А всех русскоязычных я приглашаю в ещё один телеграмм канал @avleonovrus, первым делом теперь пишу туда.
Pingback: Asset Inventory for Internal Network: problems with Active Scanning and advantages of Splunk | Alexander V. Leonov
Pingback: How to list, create, update and delete Grafana dashboards via API | Alexander V. Leonov