
How to list, create, update and delete Grafana dashboards via API. I have been a Splunk guy for quite some time, 4 years or so. I have made several blog posts describing how to work with Splunk in automated manner (see in appendix). But after their decision to stop their business in Russia last year, including customer support and selling software and services, it was just a matter of time for me to start working with other dashboarding tools.
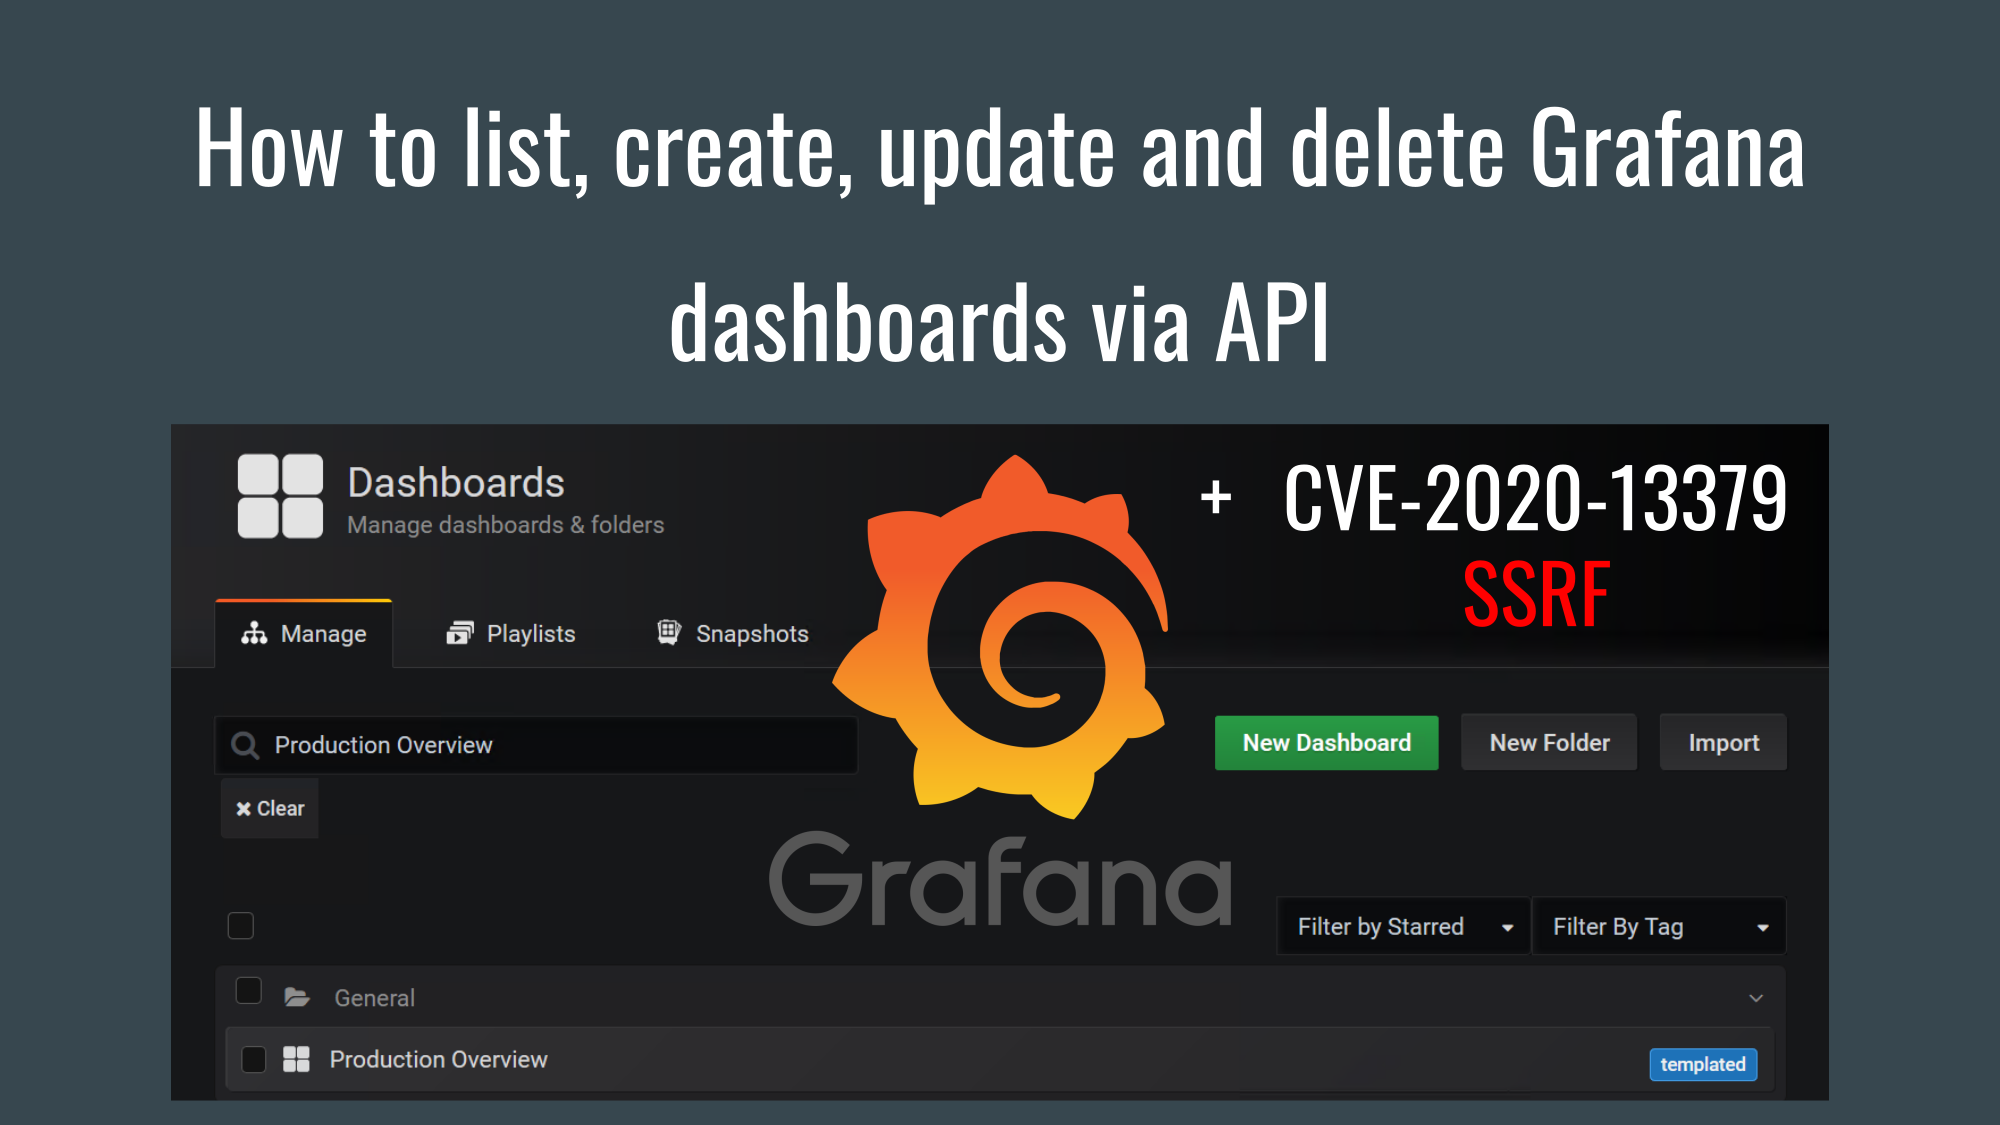
For me, Grafana has become such a tool. In this post I want to describe the basic API operations with Grafana dashboards, which are necessary if you need to create and update dozens and hundreds of dashboards. Doing all this in the GUI will be painful. Grafana has a pretty logical and well-documented API. The only tricky moments I had were getting a list of all dashboard and editing an existing dashboard.
Vulnerability
But let’s start with the news about CVE-2020-13379 vulnerability. This is a Server-side request forgery (SSRF) vulnerability in the Grafana avatar feature. SSRF means that an attacker can force a server-side application to make HTTP requests to an arbitrary domain. For example this attacker can discover the network where Grafana is running on and attack other active services. This vulnerability exists in Grafana 3.0.1 through 7.0.1, authentication is not required. This especially important for Grafana instances exposed to the internet. So, if your organization uses Grafana, it may be worth checking out its version and patch it. See more on NVD and Grafana website.
And now let’s go to API usage.
Authentication
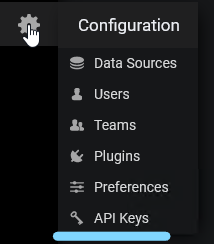
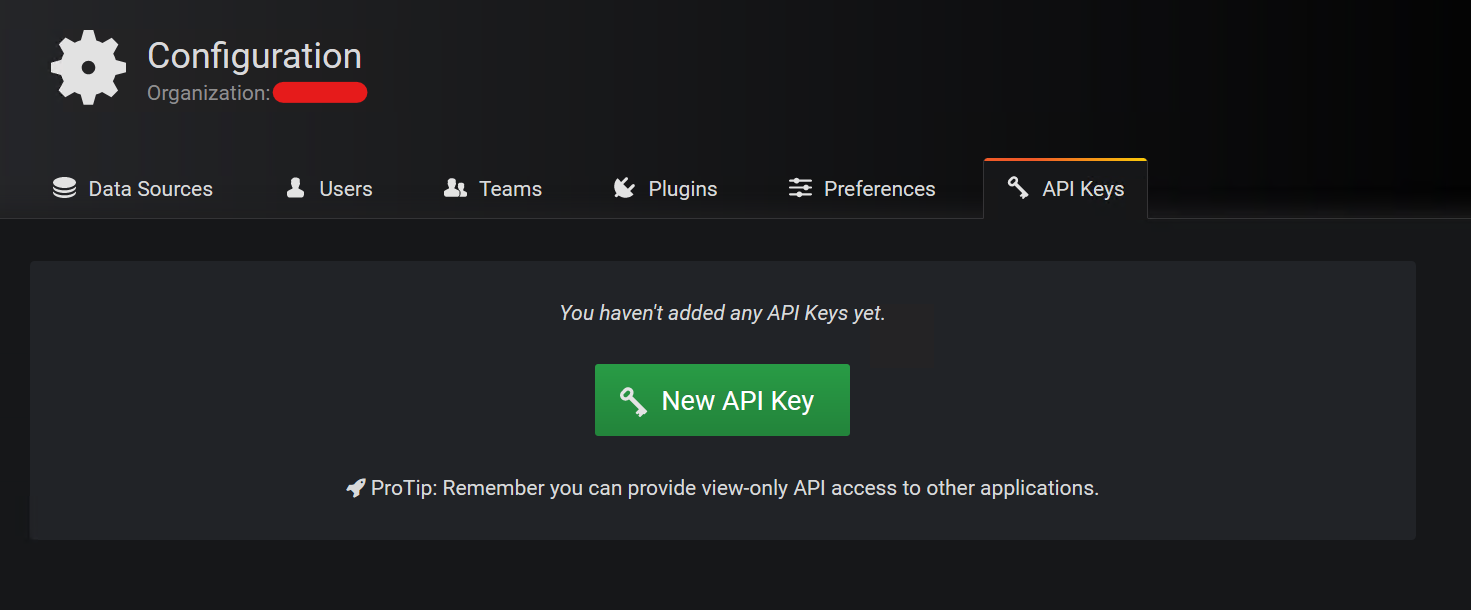
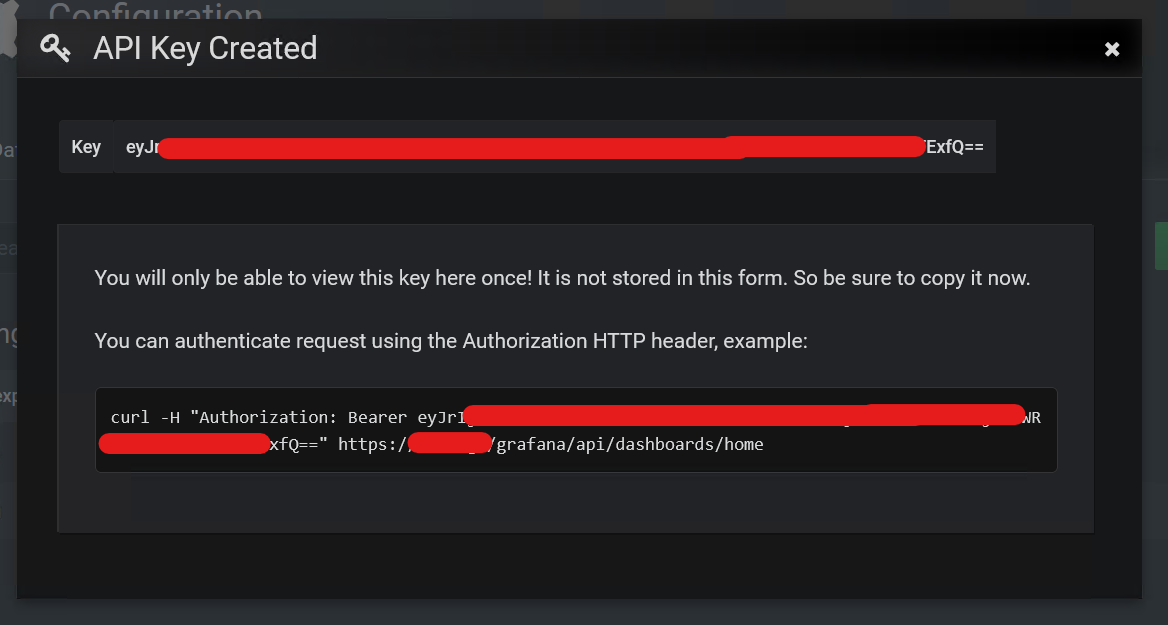
The procedure of getting authentication token for the API in Grafana is pretty straightforward. You simply open the “Configuration” section of the menu and select “API Keys”.
Then you click the “New API Key” button.
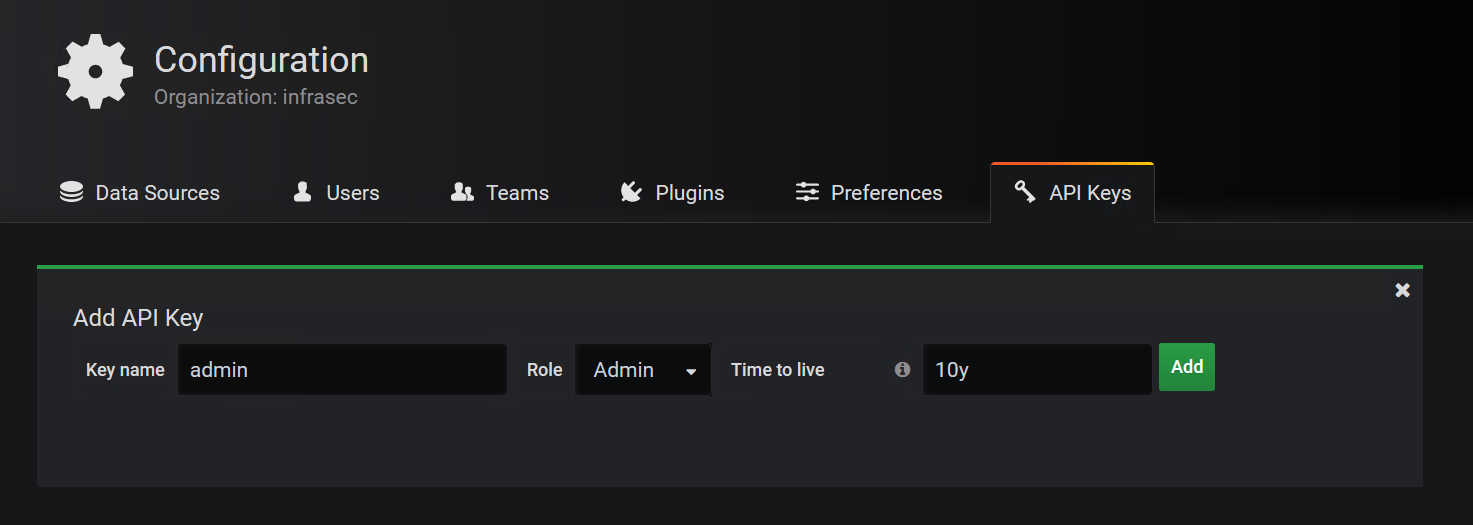
You may set the name of the key, role (I chose the maximum privilege – Admin) and time to live (I set it 10 years).
Then, the system generated a key with a good curl example that returns the description of the Home dashboard.
Getting the dashboard code
To test the key I rewrote this curl example in Python. By default, I get the description of the home dashboard, but you can get it for any other dashboard if you know the UID (by "/api/dashboards/uid/" + uid)
import requests
import json
server = "https://<your_server>/grafana"
# Example 1: Get default Home dashboard:
url = server + "/api/dashboards/home"
# To get the dashboard by uid
# url = server + "/api/dashboards/uid/" + uid
headers = {"Authorization":"Bearer #####API_KEY#####"}
r = requests.get(url = url, headers = headers, verify=False)
print(r.json())
Output:
{'meta': {'isHome': True, 'canSave': False, 'canEdit': True, 'canAdmin': False,...Creating a new dashboard
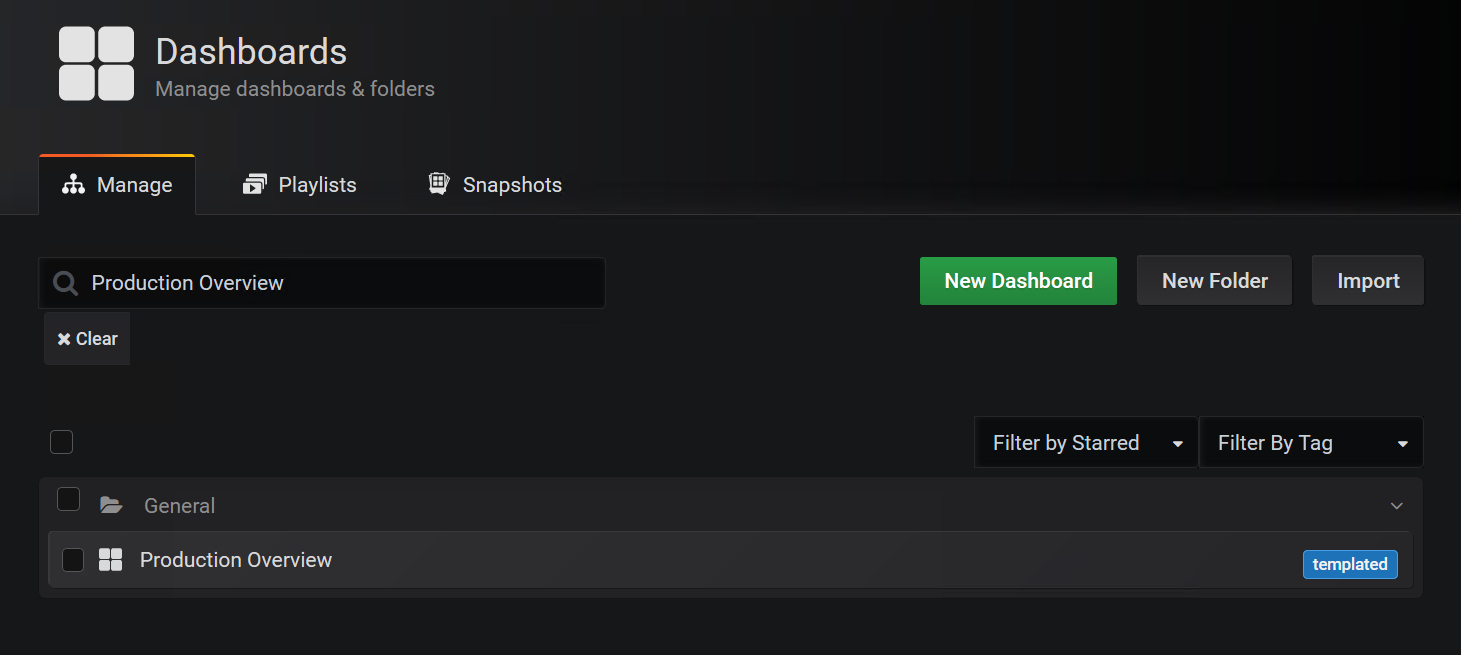
To create a new dashboard, I took the minimal json describing the “Production Overview” dashboard and made a simple post request. As a result, I get the dashboard UID.
url = server + "/api/dashboards/db"
headers = {
    "Authorization":"Bearer #####API_KEY#####",
    "Content-Type":"application/json",
    "Accept": "application/json"
}
new_dashboard_data = {
  "dashboard": {
    "id": None,
    "uid": None,
    "title": "Production Overview",
    "tags": [ "templated" ],
    "timezone": "browser",
    "schemaVersion": 16,
    "version": 0
  },
  "folderId": 0,
  "overwrite": False
}
r = requests.post(url = url, headers = headers, data = json.dumps(new_dashboard_data), verify=False)
print(r.json())
Output:
{'id': 172, 'slug': 'production-overview', 'status': 'success', 'uid': 'DoZVWjzGz', 'url': '/grafana/d/DoZVWjzGz/production-overview', 'version': 1}And here is this dashboard in the GUI:
Getting all dashboard UIDs
Well, getting all dashboard UIDs is less intuitive. There is no method to list dashboards, but you can do an empty search request and get dashboards from the results.
url = server + "/api/search?query=%"
headers = {
    "Authorization":"Bearer #####API_KEY#####",
    "Content-Type":"application/json",
    "Accept": "application/json"
}
r = requests.get(url = url, headers = headers, verify=False)
for item in r.json():
    if item['type'] == 'dash-db':
        print(item)
Output:
{'id': 172, 'uid': 'DoZVWjzGz', 'title': 'Production Overview', 'uri': 'db/production-overview', 'url': '/grafana/d/DoZVWjzGz/production-overview', 'slug': '', 'type': 'dash-db', 'tags': ['templated'], 'isStarred': False}And you can easily make title2uid dict from the found items.
Deleting dashboard
Deleting dashboards is similar to getting, but the method is DELETE. In example I delete the dashboard with given UID “DoZVWjzGz”.
uid = "DoZVWjzGz"
url = server + "/api/dashboards/uid/" + uid
headers = {
    "Authorization":"Bearer #####API_KEY#####",
    "Content-Type":"application/json",
    "Accept": "application/json"
}
r = requests.delete(url = url, headers = headers, verify=False)
print(r.json())
Output:
{'message': 'Dashboard Production Overview deleted', 'title': 'Production Overview'}Updating dashboard
The most difficult part is editing or updating an existing dashboard. Why you may need this if you can just delete and create a new one? Well, this new one will have new UID and the UID is in the dashboard’s URL. This means that if you give the URL to your colleague, it won’t work if you delete dashboard and create a new one with the same title. So, the update operation is necessary. In the example, I get data for an existing dashboard by UID, extract it’s id and version. Then I get the minimal data for the dashboard, set id, uid, incremented version and set overwrite parameter to true. Then I make the same request as for creating a new dashboard.
import copy
headers = {
    "Authorization":"Bearer #####API_KEY#####",
    "Content-Type":"application/json",
    "Accept": "application/json"
}
new_dashboard_data = {
  "dashboard": {
    "id": None,
    "uid": None,
    "title": "Production Overview",
    "tags": [ "templated" ],
    "timezone": "browser",
    "schemaVersion": 16,
    "version": 0
  },
  "folderId": 0,
  "overwrite": False
}
# Let's say you have uid
uid = "V6Co1jzGz"
# get the content of dashboard from the example above
url = server + "/api/dashboards/uid/" + uid
r = requests.get(url=url, headers=headers, verify=False)
dash_data = r.json()
import copy
dashboard_data = copy.deepcopy(new_dashboard_data)
dashboard_data["dashboard"]['id'] = dash_data['dashboard']['id']
dashboard_data["dashboard"]['uid'] = uid
dashboard_data["dashboard"]['version'] = dash_data['dashboard']['version'] + 1
dashboard_data["overwrite"] = True
url = server + "/api/dashboards/db"
r = requests.post(url=url, headers=headers, data=json.dumps(dashboard_data), verify=False)
print(r.json())
Output:
{'id': 185, 'slug': 'production-overview', 'status': 'success', 'uid': 'V6Co1jzGz', 'url': '/grafana/d/V6Co1jzGz/production-overview', 'version': 6}That’s all for today. I hope this was helpful. Another big question is how to manage the panels in dashboards, but I’m going to describe this next time.
Appendix 1. My Splunk posts
- Retrieving data from Splunk Dashboard Panels via API
- Creating Splunk Alerts using API
- Accelerating Splunk Dashboards with Base Searches and Saved Searches
- How to create and manage Splunk dashboards via API
- Asset Inventory for Internal Network: problems with Active Scanning and advantages of Splunk
- Sending tables from Atlassian Confluence to Splunk
- Sending FireEye HX data to Splunk
- How to correlate different events in Splunk and make dashboards
- Making Splunk searches using REST API
- Tracking software versions using Nessus and Splunk
- Export anything to Splunk with HTTP Event Collector
- Exporting Nessus scan results to Splunk

Hi! My name is Alexander and I am a Vulnerability Management specialist. You can read more about me here. Currently, the best way to follow me is my Telegram channel @avleonovcom. I update it more often than this site. If you haven’t used Telegram yet, give it a try. It’s great. You can discuss my posts or ask questions at @avleonovchat.
А всех русскоязычных я приглашаю в ещё один телеграмм канал @avleonovrus, первым делом теперь пишу туда.
Thanks! Much appreciated.
Thanks for great article
Pingback: Vulnerability Intelligence based on media hype. It works? Grafana LFI and Log4j “Log4Shell” RCE | Alexander V. Leonov