How to correlate different events in Splunk and make dashboards. Recently I’ve spent some time dealing with Splunk. Despite the fact that I have already done various Splunk searches before, for example in “Tracking software versions using Nessus and Splunk“, the correlation of different events in Splunk seems to be a very different task. And there not so many publicly available examples of this on the Internet. So, I decided to write a small post about it myself.
Disclaimer: I’m not a pro in Splunk. I don’t have an idea if I am doing this the right or in optimal way. 😉 I just learned some tricks, they worked for me well and I want to share it with you.
I will show the following case:
- We have some active network hosts.
- Some software product should be installed these hosts.
- We will send “host X is active” and “software is installed on host X” events to the Splunk server.
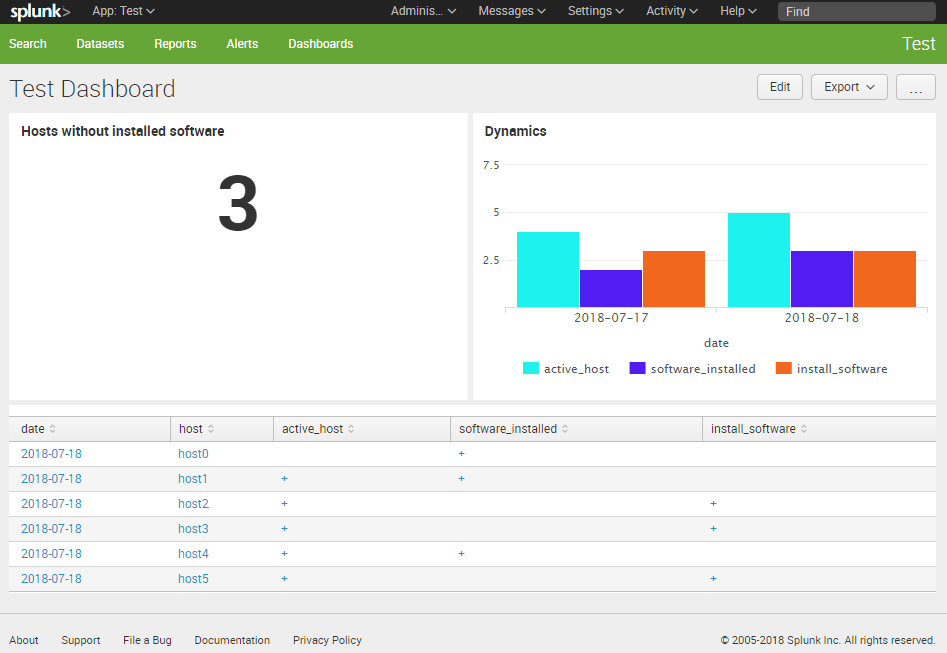
- We want to get some diagrams in Splunk that will show us on which hosts the software is installed and how number of such hosts is changing in time.
As you can see, the task is quite a trivial and it can be easily implemented in pure Python. But the idea is to make it in Splunk. 😉