Category Archives: Topics

Asset Inventory for Network Perimeter: from Declarations to Active Scanning

Asset Inventory for Network Perimeter: from Declarations to Active Scanning. In the previous post, I shared some of my thoughts about the good Asset Inventory system. Of course, for me as a Security Specialist, it would be great if IT will provide such magical system. 🙂 But such an ideal situation is rarely possible. So now let’s see how to build an Asset Inventory system using the resources of Information Security team.

There are no special secrets. It’s necessary to get information about the assets from all available IT systems and then get the rest of the data using our own Assessment tools. I would like to start with hosts on Network Perimeter. The Network Perimeter targets are available at any time for hacker attacks, that’s why this part of the network is the most critical.
Asset Inventory for Network Perimeter

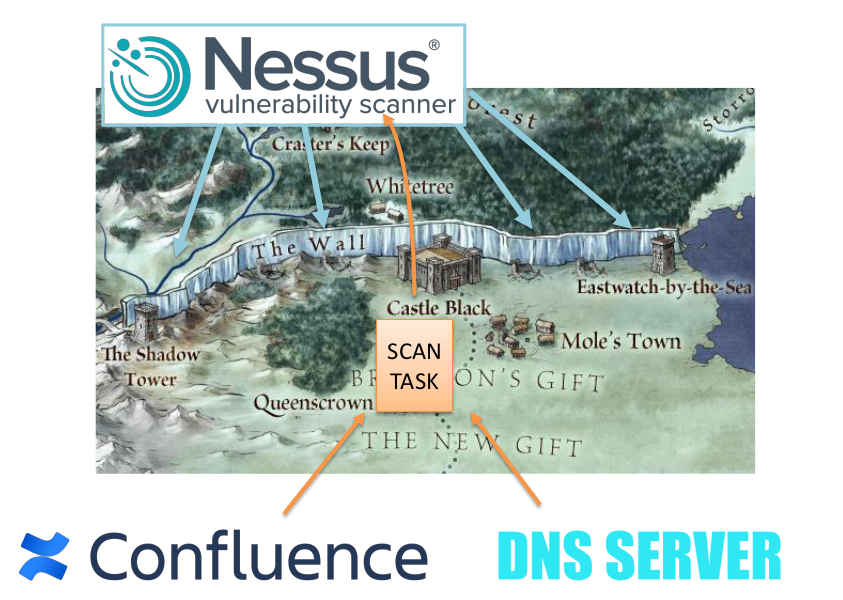
Network Perimeter is like the Wall in the Game of Thrones. The same white walkers are hiding behind the wall and our task is to find the breaches in the wall faster than potential intruders. “Night gathers, and now my watch begins”. (c)

Perimeter is changing constantly. And we should understand at any time what hosts are currently exposed in every office and every external hosting platform.

We can get information about external hosts using some Vulnerability Scanner located on external host in the Internet. I have already wrote about it briefly in  Vulnerability Management for Network Perimeter. Here I would like focus on how we can understand which hosts should be scanned and what useful information we can get from the raw scan results.

Continue reading →

What I expect from IT Asset Inventory

What I expect from IT Asset Inventory. The main problem of vulnerability management, in my opinion, is that it is not always clear whether we know about ALL network hosts existing in our infrastructure or not. So, not the actual process of scanning and the detection of vulnerabilities, but the lack of knowledge what we should scan.

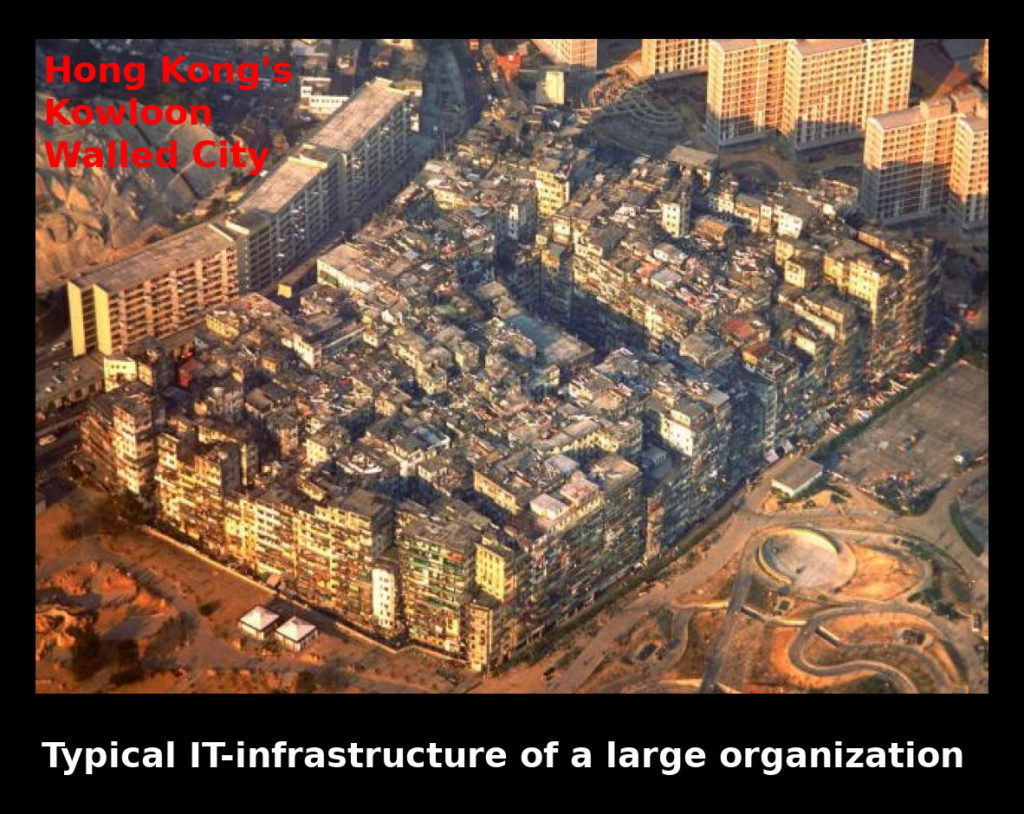
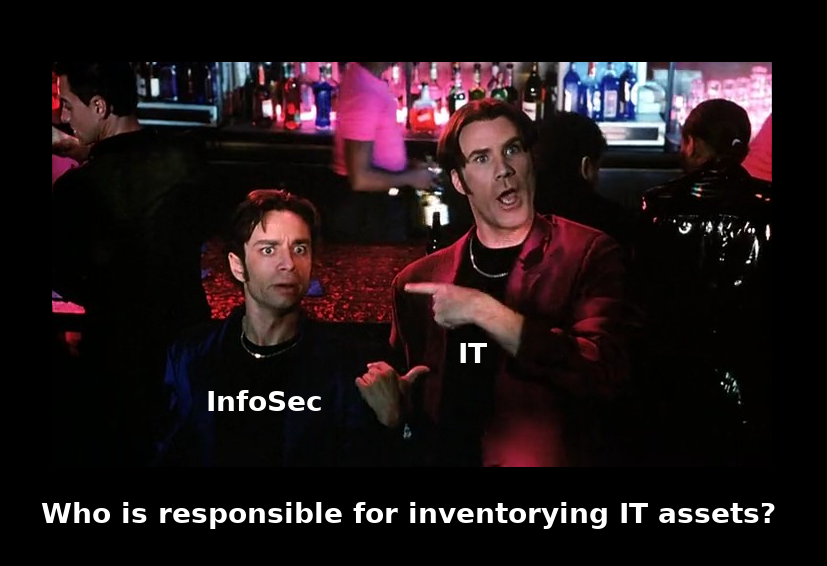
Knowing the total number of active hosts, this must be such a simple and basic thing. But for a large organization, this is not so trivial. To tell the truth, I do not know how to do IT Asset Inventory right. I’m not even sure who should be responsible this. There are so many different technological and organizational nuances. I will mention some of them below.

Who is responsible for inventorying IT assets?

But I can say with confidence that my basic requirement for IT Asset Inventory system will be the completeness of the scope, not the number of collected parameters. The very minimum is just to see that some network host existed and seemed active at some time.

Continue reading →

Sending tables from Atlassian Confluence to Splunk

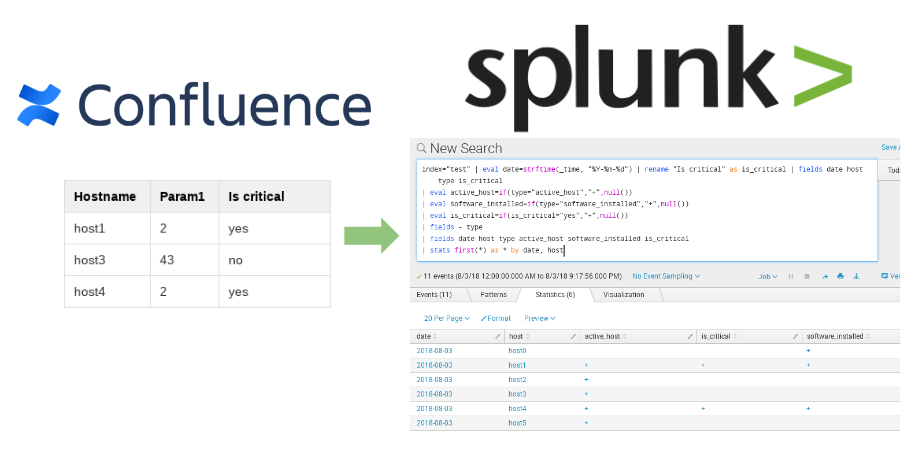
Sending tables from Atlassian Confluence to Splunk. Sometimes when we make automated analysis with Splunk, it might be necessary to use information that was entered or edited manually. For example, the classification of network hosts: do they belong to the PCI-DSS Scope or another group critical hosts or not.

Sending tables from Atlassian Confluence to Splunk

In this case, Confluence can be quite a convenient tool for maintaining such a registry. Page with a table can be created very quickly and multiple employees can immediately start working with it.

Let’s see how to convert such table, export it to Splunk and use it with other data.

Continue reading →

Sending FireEye HX data to Splunk

Sending FireEye HX data to Splunk. FireEye HX is an agent-based Endpoint Protection solution. Something like an antivirus, but focused on Advanced Persistent Threats (APT). It has an appliance with GUI where you can manage the agents and see information about detected security incidents.

As with any agent-based solution, it’s necessary to ensure that the agents are installed on every supported host in your network. You may also want to analyze the alerts automatically. And for both purposes you can use Splunk. Let’s see how to do it. 😉

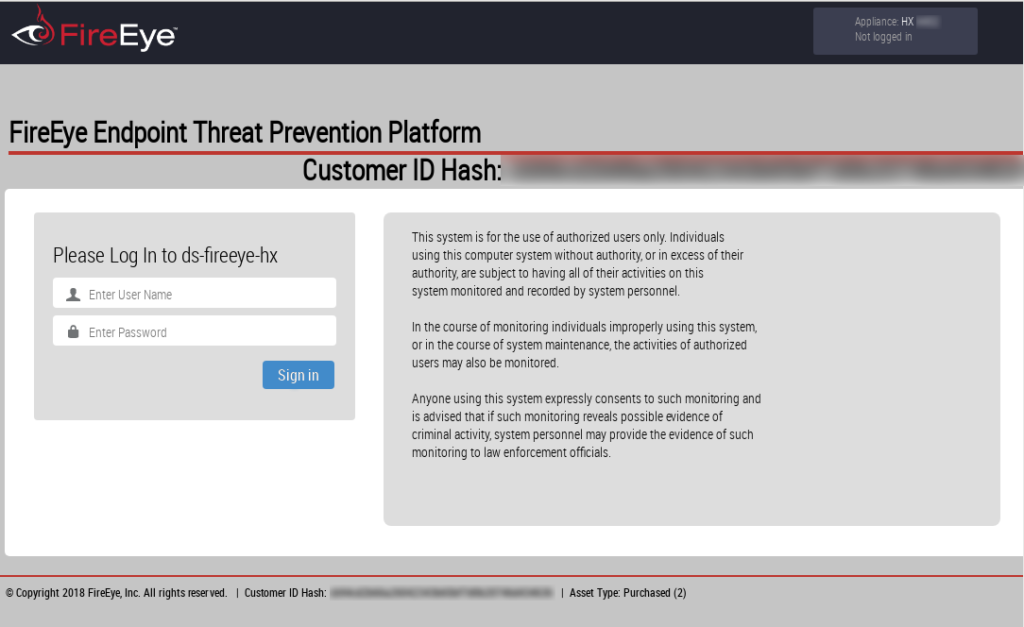
FireEye HX appliance login screen

Note, everything bellow is for FireEye Endpoint Security (HX) 4.0.6 and Splunk 7.0.2. If you use some other version, the things may be quite different.

The main idea is following. We should present FireEye hosts and alerts data in JSON format, add some mandatory fields ans send this packages to Splunk using HTTP Event connector. Then we can process it in Splunk like I’ve shown in “How to correlate different events in Splunk and make dashboards“.

Continue reading →

How to correlate different events in Splunk and make dashboards

How to correlate different events in Splunk and make dashboards. Recently I’ve spent some time dealing with Splunk. Despite the fact that I have already done various Splunk searches before, for example in “Tracking software versions using Nessus and Splunk“, the correlation of different events in Splunk seems to be a very different task. And there not so many publicly available examples of this on the Internet. So, I decided to write a small post about it myself.

Splunk dashboard

Disclaimer: I’m not a pro in Splunk. I don’t have an idea if I am doing this the right or in optimal way. 😉 I just learned some tricks, they worked for me well and I want to share it with you. 

I will show the following case:

  1. We have some active network hosts.
  2. Some software product should be installed these hosts.
  3. We will send “host X is active” and “software is installed on host X” events to the Splunk server.
  4. We want to get some diagrams in Splunk that will show us on which hosts the software is  installed and how number of such hosts is changing in time.

As you can see, the task is quite a trivial and it can be easily implemented in pure Python. But the idea is to make it in Splunk. 😉

Continue reading →

Masking Vulnerability Scan reports

Masking Vulnerability Scan reports. Continuing the series of posts about Kenna (“Analyzing Vulnerability Scan data“, “Connectors and REST API“) and similar services. Is it actually safe to send your vulnerability data to some external cloud service for analysis? Leakage of such information can potentially cause great damage to your organization, right?

Masking Vulnerability Scans

It’s once again a problem of trust to vendor. IMHO, in some cases it may make sense to hide the real hostnames and ip-addresses of the target hosts in scan reports. So, it would be clear for analysis vendor that some critical vulnerability exists somewhere, but it would not be clear where exactly.

To do this, each hostname/ip-address should be replaced to some values of similar type and should be replaced on the same value each time. So the algorithms of Kenna-like service could work with this masked reports. This mean that we need to create a replacement dictionary.

Continue reading →

Kenna Security: Connectors and REST API

Kenna Security: Connectors and REST API. In the last post about Kenna Security cloud service I mentioned their main features for analyzing data from different vulnerability scanners. Now let’s see how to import Tenable Nessus scan results in Kenna. Here you can see the list of connectors for all supported products:

Kenna connectors

Three connectors for Nessus are available:

  • Nessus Importer retrieves existing scan results from your Nessus server.
  • Nessus Scanner can schedule scans on your Nessus server.
  • Nessus XML imports xml (.Nessus2) files.

First two connectors work with Nessus server directly. And they probably won’t work anymore with Nessus Professional 7, because of API removing (see “New Nessus 7 Professional and the end of cost-effective Vulnerability Management (as we knew it)“). If Nessus server is deployed on-premise you should use special Kenna Virtual Tunnel.

Last “Nessus XML” connector is the most flexible. No matter how you got your scan results, it will be possible to import them to Kenna. See how to get XML reports from from Nessus server in a post “Retrieving scan results through Nessus API“.  You can upload XML scan results using Kenna web GUI (not very efficient way, but for testing – why not?) or REST API.

To use Kenna REST API you will need an Application Token. Go to the the Settings menu -> Applications:

Kenna settings

Continue reading →